Overview
The objective of this project is to raise awareness and increase transparency about how governments are spending federal tax dollars, and be able to make comparisons between the spending of different countries.
Our target users are individuals who are curious about where their tax money goes - or any tax-paying people, for that matter. Governments can also use our tool to analyze their own federal spending. By benchmarking other countries/states on how they spend their dollars and linking them with possible policies that impact these spending habits, the solution aims to help inspire users to think of what policies they would like to see implemented in their government(s).
Before you explore...
Here are instructions on how to interact with our visualization.
Step 1:
Select a country (or countries) from the world map.
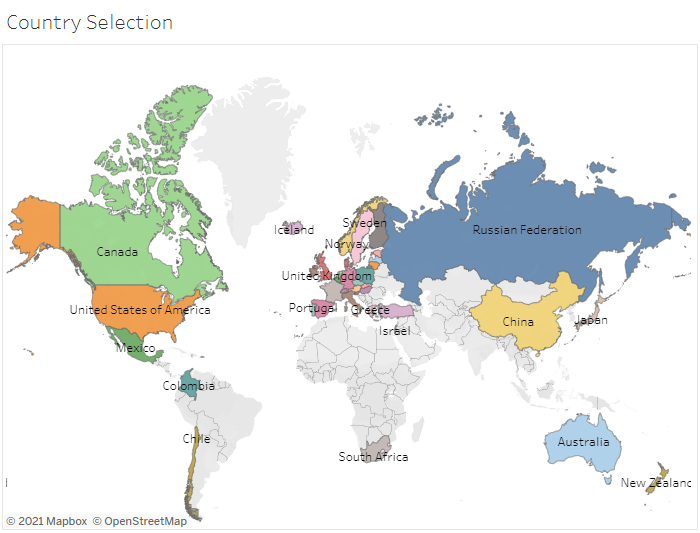
You can select countries by highlighting an area on the map, pressing your CMD or CTRL key + clicking individual countries on the map, by unselecting countries you would like to exclude in the fliter on the right, or searching by country in the top left. This will filter the data on th rest of the visualization to the countries you have selected.
Step 2:
Observe expenditure by sector...
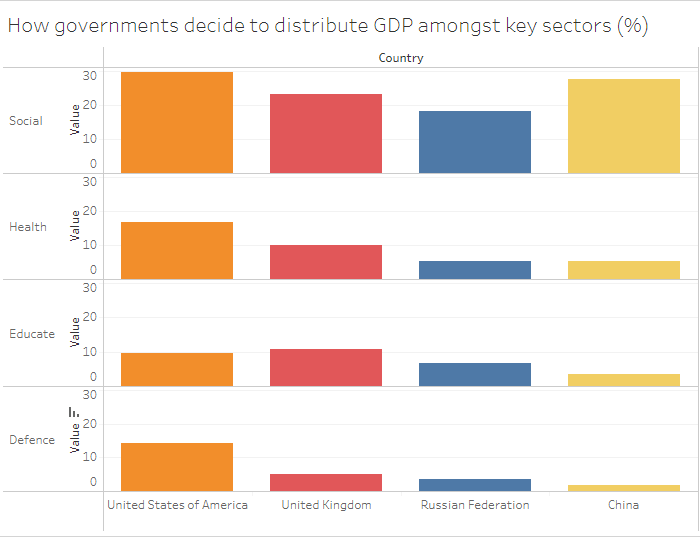
These graphs break down the expenditure of each country you have selected into four categories: social, health, education, and defense spending. The values are shows as a percentage of the total GDP. You can also sort by the various metrics by clicking their respective sort carats.
Step 3:
Observe holistic relations across sectors and countries...
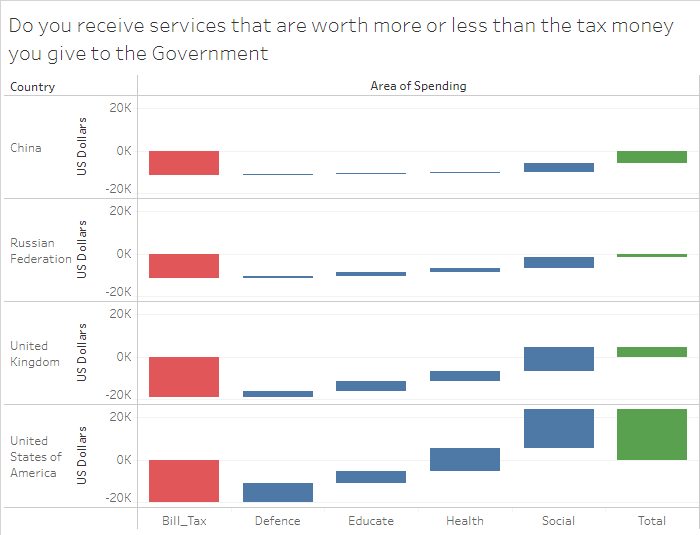
Treat the red bar as the amount you pay in taxes, and in return you recieve services in the social, health, education, and defense sectors. The four columns in the middle show breakdown the value of services you recieve in each sector, and the green bar depicts how much extra value you gained in services from the government relative to the taxes you paid.