The Olympians is a project focused on better understanding Summer Olympic data from 1896 through 2016.
Our goal is to provide interactive and informative visuals to help any sports fan better understand the most prestigious sports event worldwide!
– Kelly, Jocelyn, Justin, Spencer

Who gets the gold?
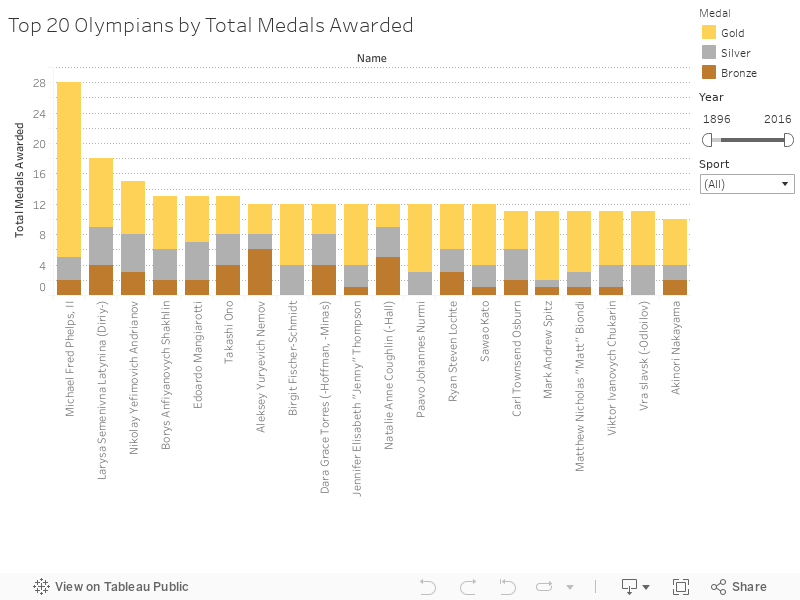
This visualization shows the top 20 Olympians by the amount of medals they have received. It is color coded by medal, separated by year received, and can be further filtered by years or sports.
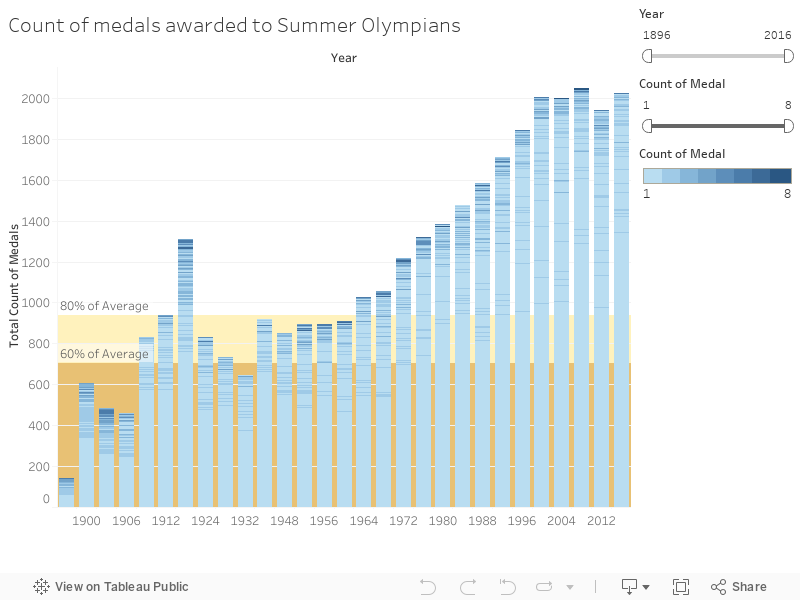
This visualization shows the total medals awarded to Olympians each year, separated by athlete with two lines to distinguish the 60% and 80% of average lines. It can be further filtered by year or medal count to see how many medals athletes won each year compared to average.
A summary measure between 0 and 1 for countries of average achievement in key dimensions of human development like life expectancy, education, and GNI (gross national income) per capita
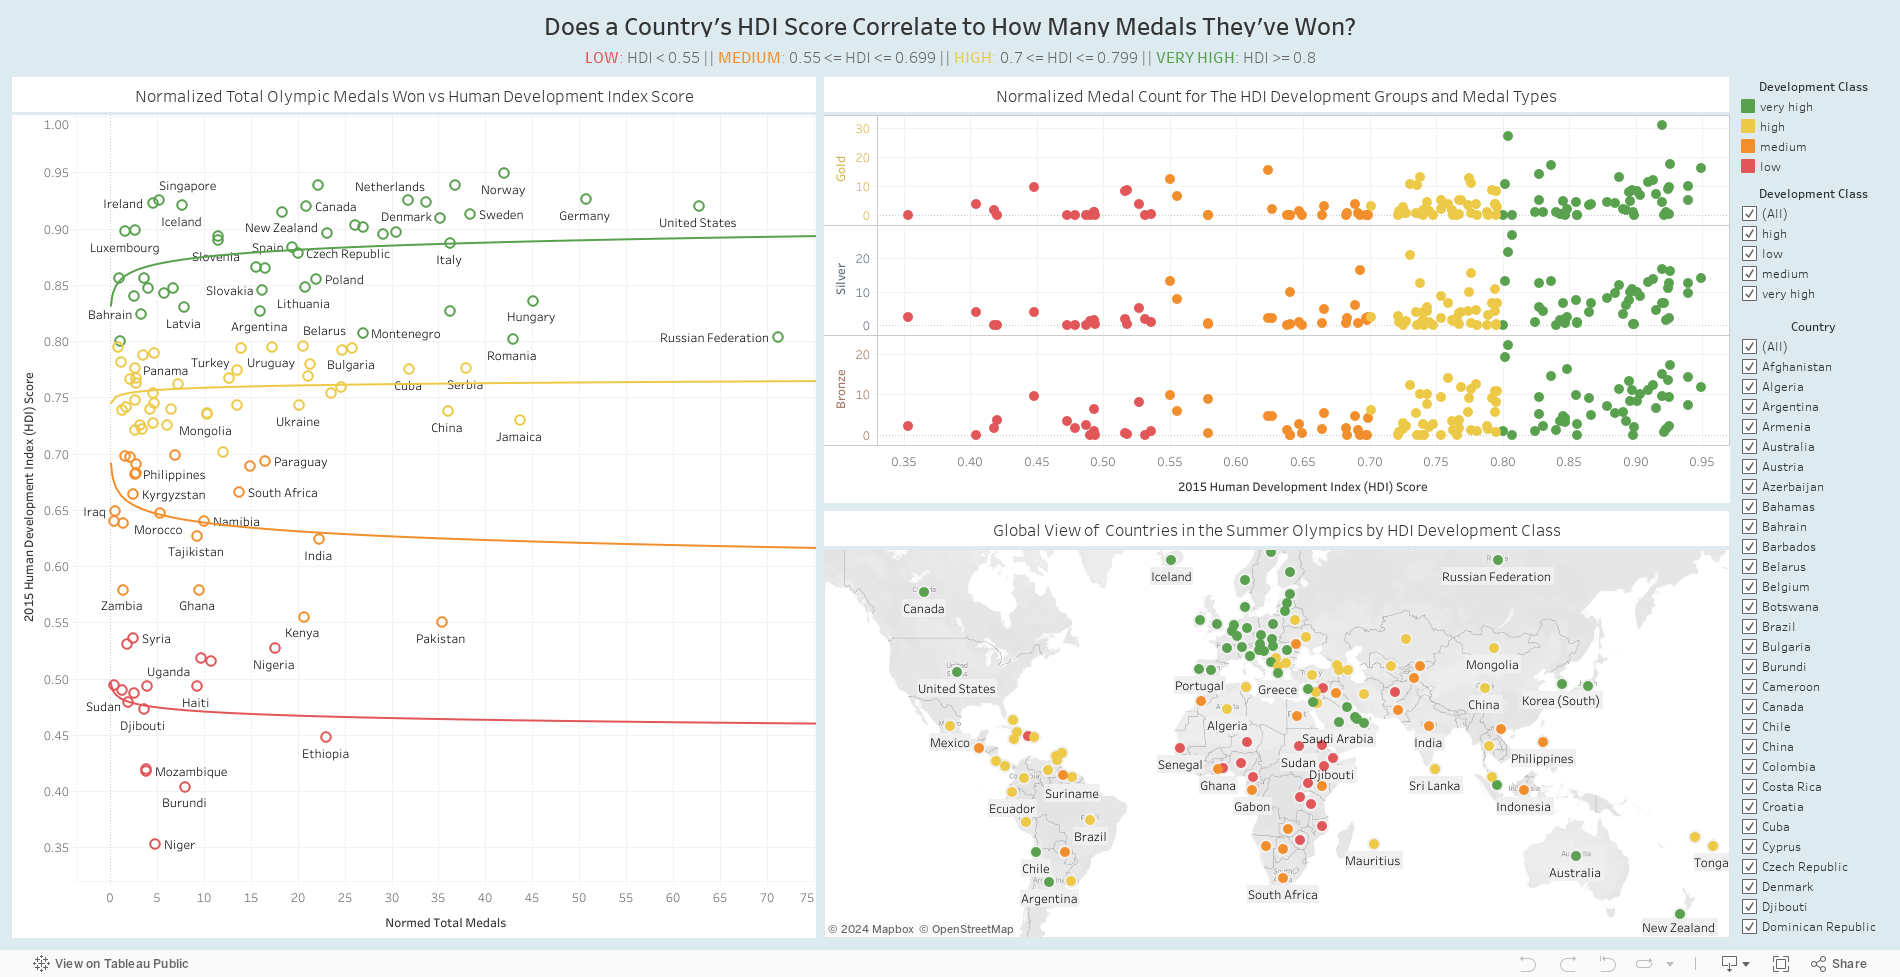
Visual 1: Normalized Total Olympic Medals Won vs Human Development Index Score
This visualization demonstrates the trends between countries within the same development class (color-coded) based on their HDI score in 2015. With HDI Score on the y-axis and the normalized total medal count on the x-axis, we can see via the trend line, whether or not there is a positive correlation between these two variables. A positive correlation in this graph confirms the hypothesis that a higher HDI score for the country results in a higher medal count across the events while a negative correlation represents lower HDI scores equalling a higher medal count.
Visual 2: Normalized Medal Count for The HDI Development Groups and Medal Types
This visualization simply plots all of the participating countries (color coded in their respective development classes) with how many gold, silver, and bronze medals that have been won over all the olympics. While only a slight upwards trend is noticeable, we can confirm that on average, the higher the development class, the more medals are won. It is important to note that in both this visualization and the first one, the number of medals are normalized to reflect the total number of athletes participating in events, so that no one country can skew the data just because they have many more athletes in events.
Visual 3: Global View of Countries in the Summer Olympics by HDI Development Class
This visualization shows the location of the participating countries around the world- color coded to represent their standing amongst the HDI development classes.
Does the host get the most?
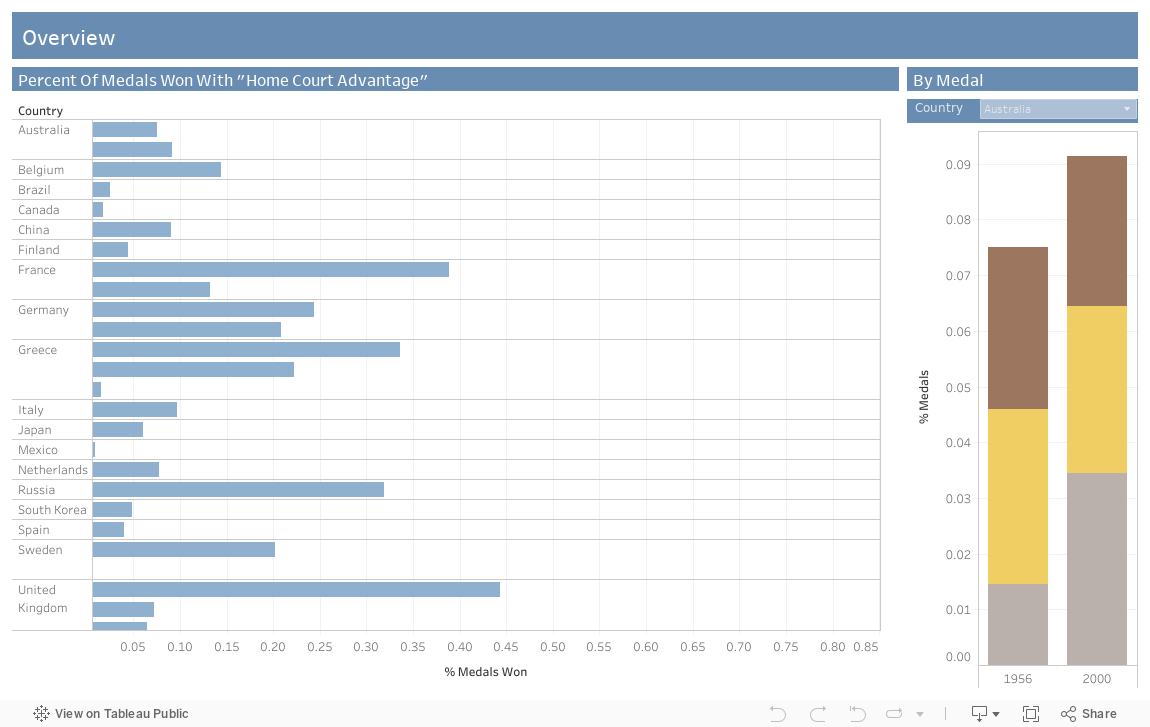
Overview Visualization 1: Percent of Medals Won with “Home Court Advantage”
Looking at only each countries performance when they were the host country, what percentage of the medals for that specific Olympic game, did they win.
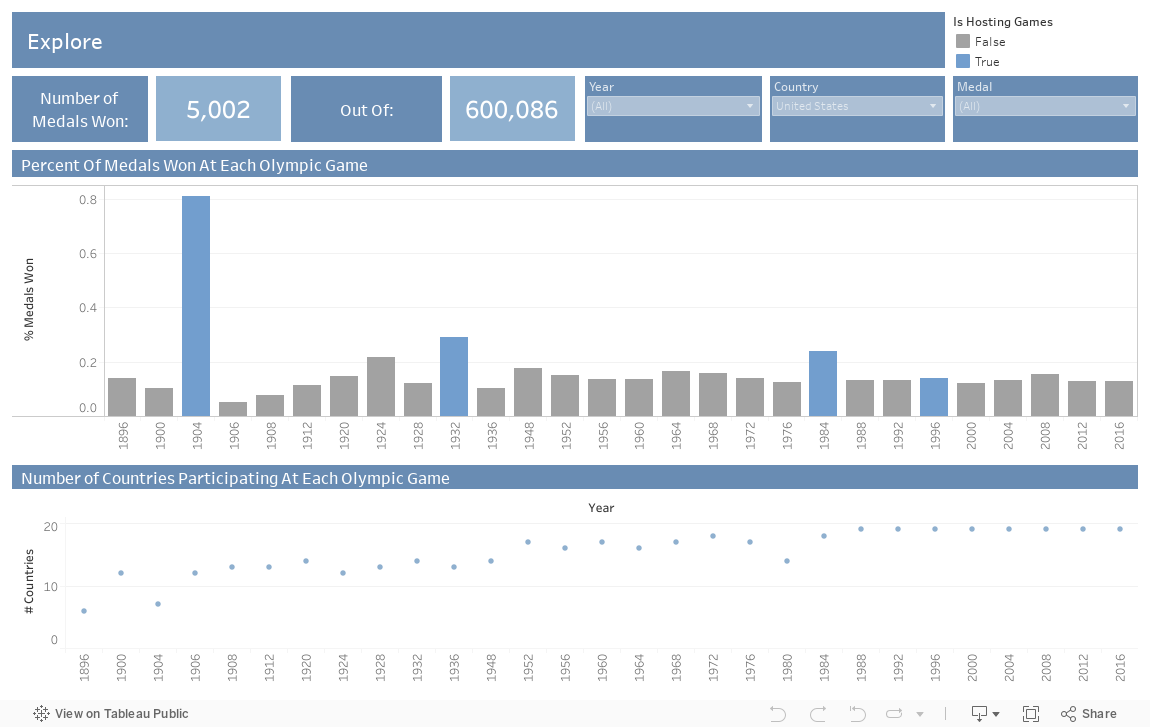
Explore Visualization 1: Percent of Medals Won at Each Olympic Game
For an individual countries performance throughout time, what percentage of the medals for each Olympic game did they win. This visualisation is color coded by blue when that respective country is also the host country and gray when they are not. This way, we can easily determine whether games in which a county is the host seemed to have a higher percentage of medals won, hence home court advantage.
Overview Visualization 2: By Medal
Similar to visualization 1 on this page, looking at only each countries performance when they were the host country, what percentage of the medals for that specific Olympic game, did they win. However, this is broken down even further to show the percentage of gold, silver, and bronze medals won.
Explore Visualization 2: Number of Countries Participating At Each Olympic Game
A scatterplot of how many unique countries participated at each Olympic Game throughout time.

What we hope to accomplish with The Olympians
Goals
Give an overview of 120 years worth of summer olympic games including athlete, country, and event data.
Actions
Create an interactive platform for any sports enthusiasts to learn more about the summer Olympics.
Design
We strive to make our visualizations as user friendly and intuitive as possible, with user testing to back it up.
Takeaways
We hope to prove move insight into how the Olympics have evolved along with its talented athletes over time