Overview
San Francisco’s Municipal Transportation Agency states that its mission is to “connect SF through a safe, equitable, and sustainable transportation system”.
We evaluated the extent to which SFMTA is meeting these goals for specific vulnerable communities most in need of public transit. We will model how accessibility to essential services varies across different San
Francisco neighborhoods and suggest key areas for improvement.
factors that define accessibility:
FARE COSTS
TRANSIT OPTIONS
TRAVEL TIME
ESSENTIAL SERVICES

Reliability

Walkability
essential services:
education
childcare
employment
medical care
food/ clothing
recreational activities
Explore
Can San Francisco’s vulnerable demographics access essential services?
ROUTES

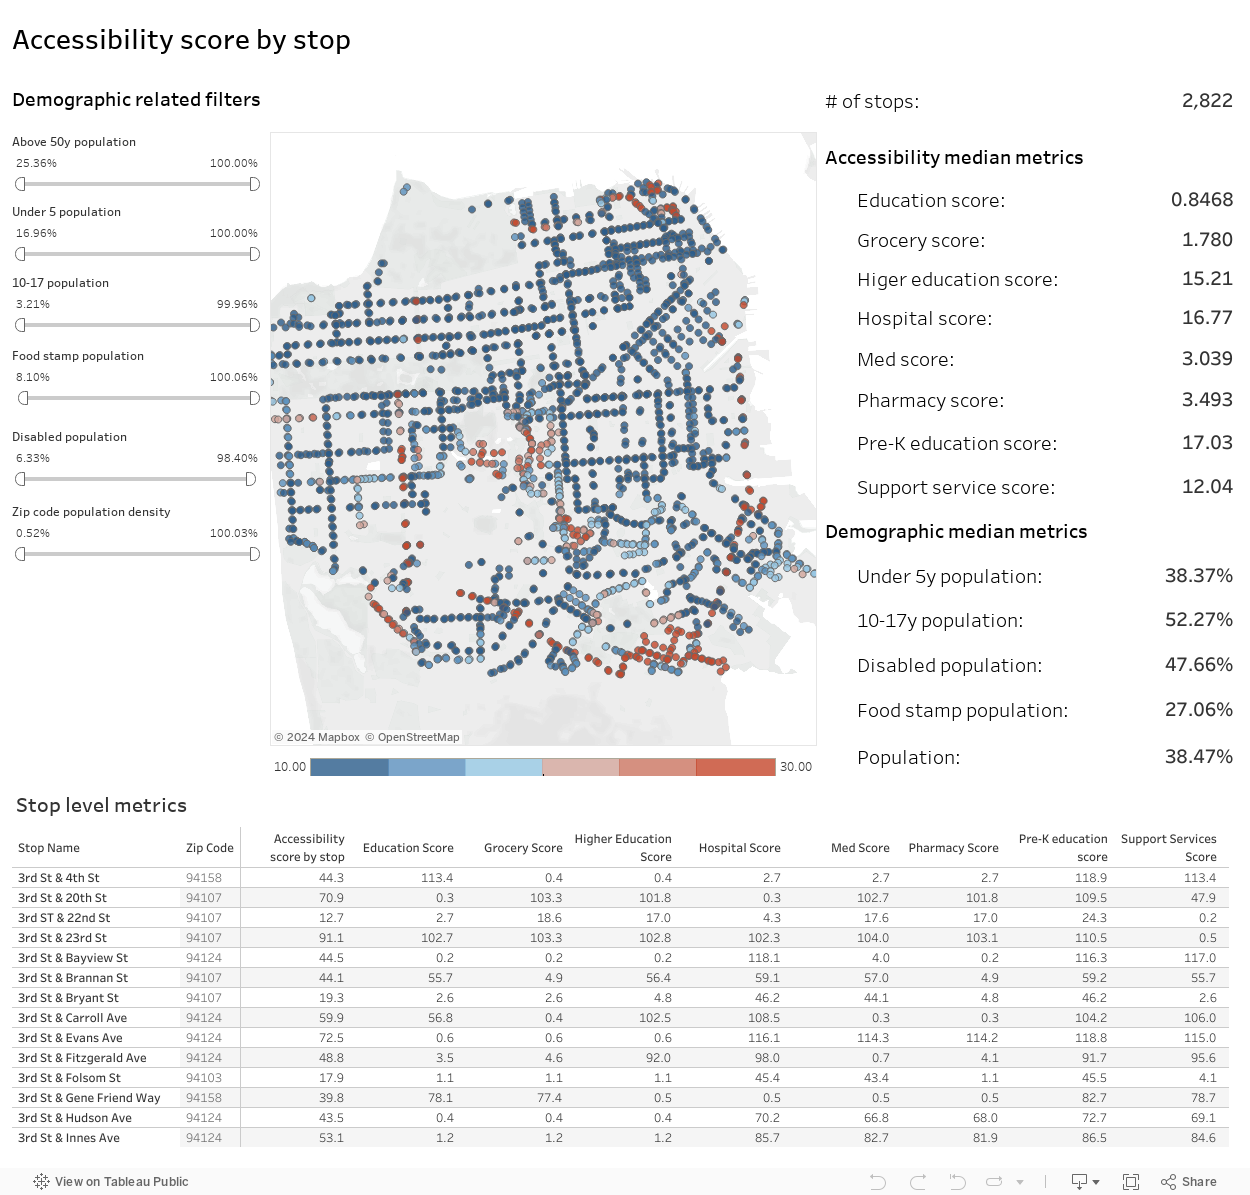
ACCESIBILITY SCORE BY STOP
ACCESIBILITY SCORE BY ZIP CODE

Analyze
ACCESS TO GROCERY STORES
We paid particular attention to zip codes with high proportions of vulnerable demographics such as low income, youth, seniors, and those with disabilities. For each stop, we calculated a travel time score–defined as the shortest path to the nearest grocery store plus median wait time at the source–in order to allow easy comparison between stops and zip code as a whole. In the map to the right, you can see all the stops in San Francisco colored according to their median travel time, with darker colors indicating the least amount of wait time (15min or less, often this indicates a grocery store within walking distance of the stop) and the lighter colors indicating extremely long wait times (60+min). By identifying the “lightest” areas on the map, we can start to see gaps in SFMTA’s network, where residents without a car or other means of transportation may struggle to quickly and readily access fresh food.
ACCESS TO ARTERIES
Access to "arteries"—important routes with frequent service—is the biggest driver of decreased travel time. A stop along this route may be a little further from the end service--but you'd only have to wait 8 to 10 minutes for the next bus, so the payoff is more than worth it, But if no such arteries are within walking distance from your home or you're physically unable to make the trek, then travel times shoot up and users have to make several transfers to get to one of these main routes. For this reason, we will be looking at not just stop level information but the median travel time at a zip code level—there may be one or two stops with lightening fast access times, but if all others are relatively poorly connected, then that will negatively impact those unable to travel to those key stops.
ACCESS TO CHILDCARE
Childcare services like daycare and kindergarten do not have even distribution across San Francisco. A distribution of services like this will lead to increased expected travel times for communities that are either off core arteries, or have no local services. Our data set shows that there are no known kindergartens or day cares in Bayview, for example. This means that families with small children living in that community will have longer travel times than the average for the network.
ACCESS TO EDUCATION
Only 235 nodes in the network are not within walking distance of at least one school. This tells us that distribution of schools across the city is high, which will lead to reduced travel times for students traveling via public transit to the nearest node with at least one school. For future analysis, to understand travel times better, more work can be done by splitting schools into age group buckets like public vs. private or what grade levels are available at each school. Adding granularity could improve our understanding of access to these various sub-categories.
ACCESS TO PRIMARY, EMERGENCY, AND ASSISTIVE MEDICAL CARE
We were particularly interested in understanding how seniors and the disabled are able to access relevant services and so we split medical services into three categories–medical, non-emergency offices, such as those practices belonging to doctors and dentists, emergency clinics and hospitals, and assistive medical care. This final category includes senior community centers, assisted living, as well as physical and mental rehabilitation, all services commonly used by our target groups of interest.
WEEKLY RIDERSHIP AS OF MAY 2022
The Team
We are a group of graduate students in the Master of Information and Data Science program at the University of California, Berkeley.


