Analysis of Time Trends
This tab focuses on the break-down of salary time trend for Data Scientists from three perspectives: Country, Experience Level, Company Size. The first part looks at the time trend by country. The second part looks at the time trend by experience level and company size both individually and interactively via click and select cross-filter.
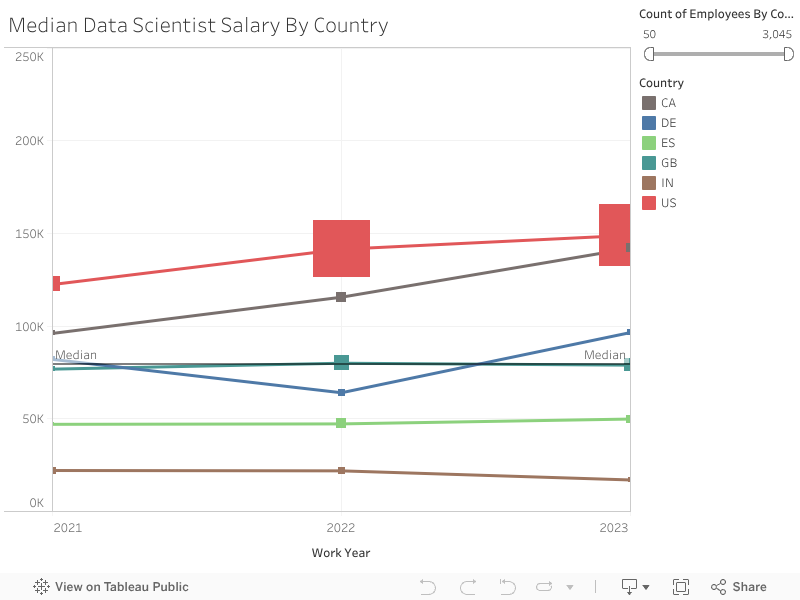
Time Trend by Country
This section focuses on the checking the yearly trend for each country. The colors represent different countries with pre-filtering to show countries with over 50 jobs reported in total. The size of the squares represent the number of jobs reported. The user can filter by country to see the trend of a specific country or leave the countries as “All” to compare the time trend for all major countries.
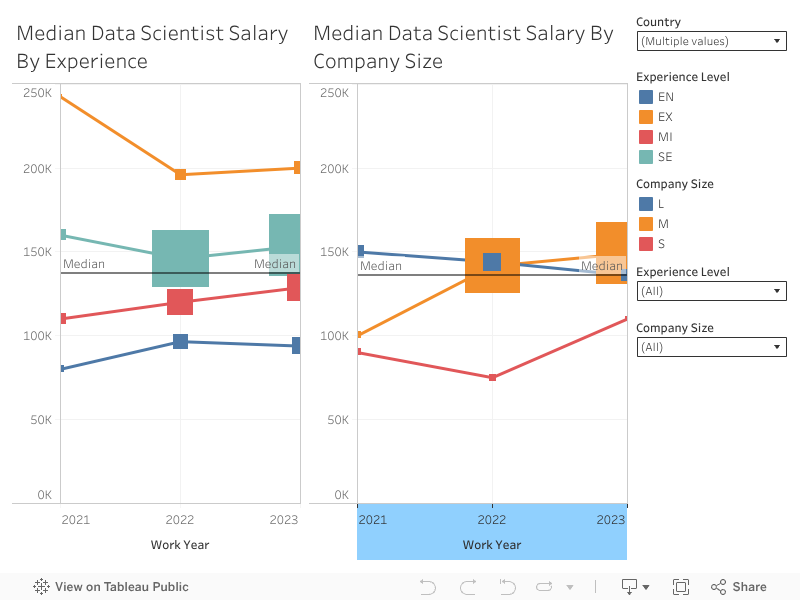
Time Trend by Experience & Company Size
These graphs check the time trend of DS salaries by Experience Level and Company Size both individually and interactively via a select & click cross-filter. The colors represent different experience levels and company sizes accordingly on each visualization. The size of the squares represent the number of jobs reported. You can filter the countries to see the trend of a specific country. The default country values are set to “US” + “CA”
Use Case 1: Check time trend from Experience & Company Size separately
Action: Leave the dashbaord alone without clicking on anything analyze each visualization separately.
Use Case 2: Users know their experience level and want to know what company size to join or switch to
Action: Click on an experience level on the first viz, and the second viz will be cross filtered to reflect the salary trend for different company size for that experience level.
Use Case 3: User wants to check growth trend for a current or future level for their company size (L, M, S)
Action: Click on a company size on the second vis and the first vis will reflect the salary trend for each experience level for that selected company size.
| Experience Level | Description |
|---|---|
| EN | Entry-level |
| MI | Mid-level |
| SE | Senior level |
| EX | Executive level |
| Company Size | Description |
|---|---|
| S | Small (less than 50 employees) |
| M | Medium (50 - 240 employees) |
| L | Large (greater than 250 employees) |