Evaluating Player & Positional Workrates in the WNBA
About these tools
Welcome!
The tools you are about to use are intended for WNBA coaching teams and head office staff.

Data Sources
We used wehoop (go to wehoop) to gather WNBA games' data. wehoop is an R package for working with women’s college and professional basketball data. The package has functions to access live play by play and box score data from ESPN with shot locations when available. From wehoop we gathered the following datasets:
- Play-by-Play
- Player Box Scores
- Team Box Scores
- WNBA Standings
- WNBA Schedule
- WNBA Teams
Goal 1: In-Game Management
The first intended audience of these analytical tools are WNBA coaching teams. The goal is to help them take the best decisions during game situations by presenting relevant information about both players on their own team's roster and players in the opposing team.
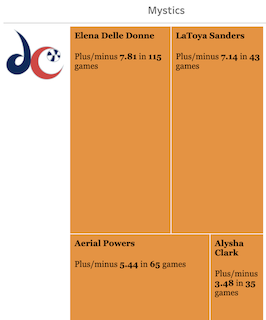
More specifically, the tree maps let the coaching team quickly see who the players with highest and lowest plus/minus scores. Available filters include years, teams and player position. The shot maps help coaching teams know from which locations each player in any team has been more or less effective, based on made or missed in-game actions.
Goal 2: Players Scouting
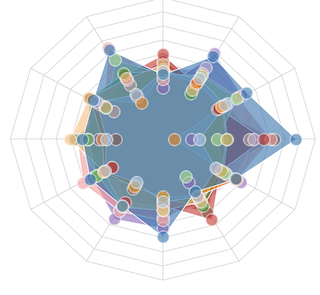
The second intended audience are WNBA team head offices. The goal of the radar charts is to evaluate new players or compare their team on the aggregate to the opposing team.
Head office staff can also leverage tree maps and shot charts to find players in the league who are particularly well-suited to needs of the team, or to gather information for future contract negotiations, trades, etc.
Instructions for Interacting with the Visuals
Each visual is accessible via the menu items on the left of the page.
Please click through, hover over regions of interest and change the filters to match your interests.
More detailed instructions can be found in each visualization's page.