Radar Chart Analysis
WNBA Radar Charts
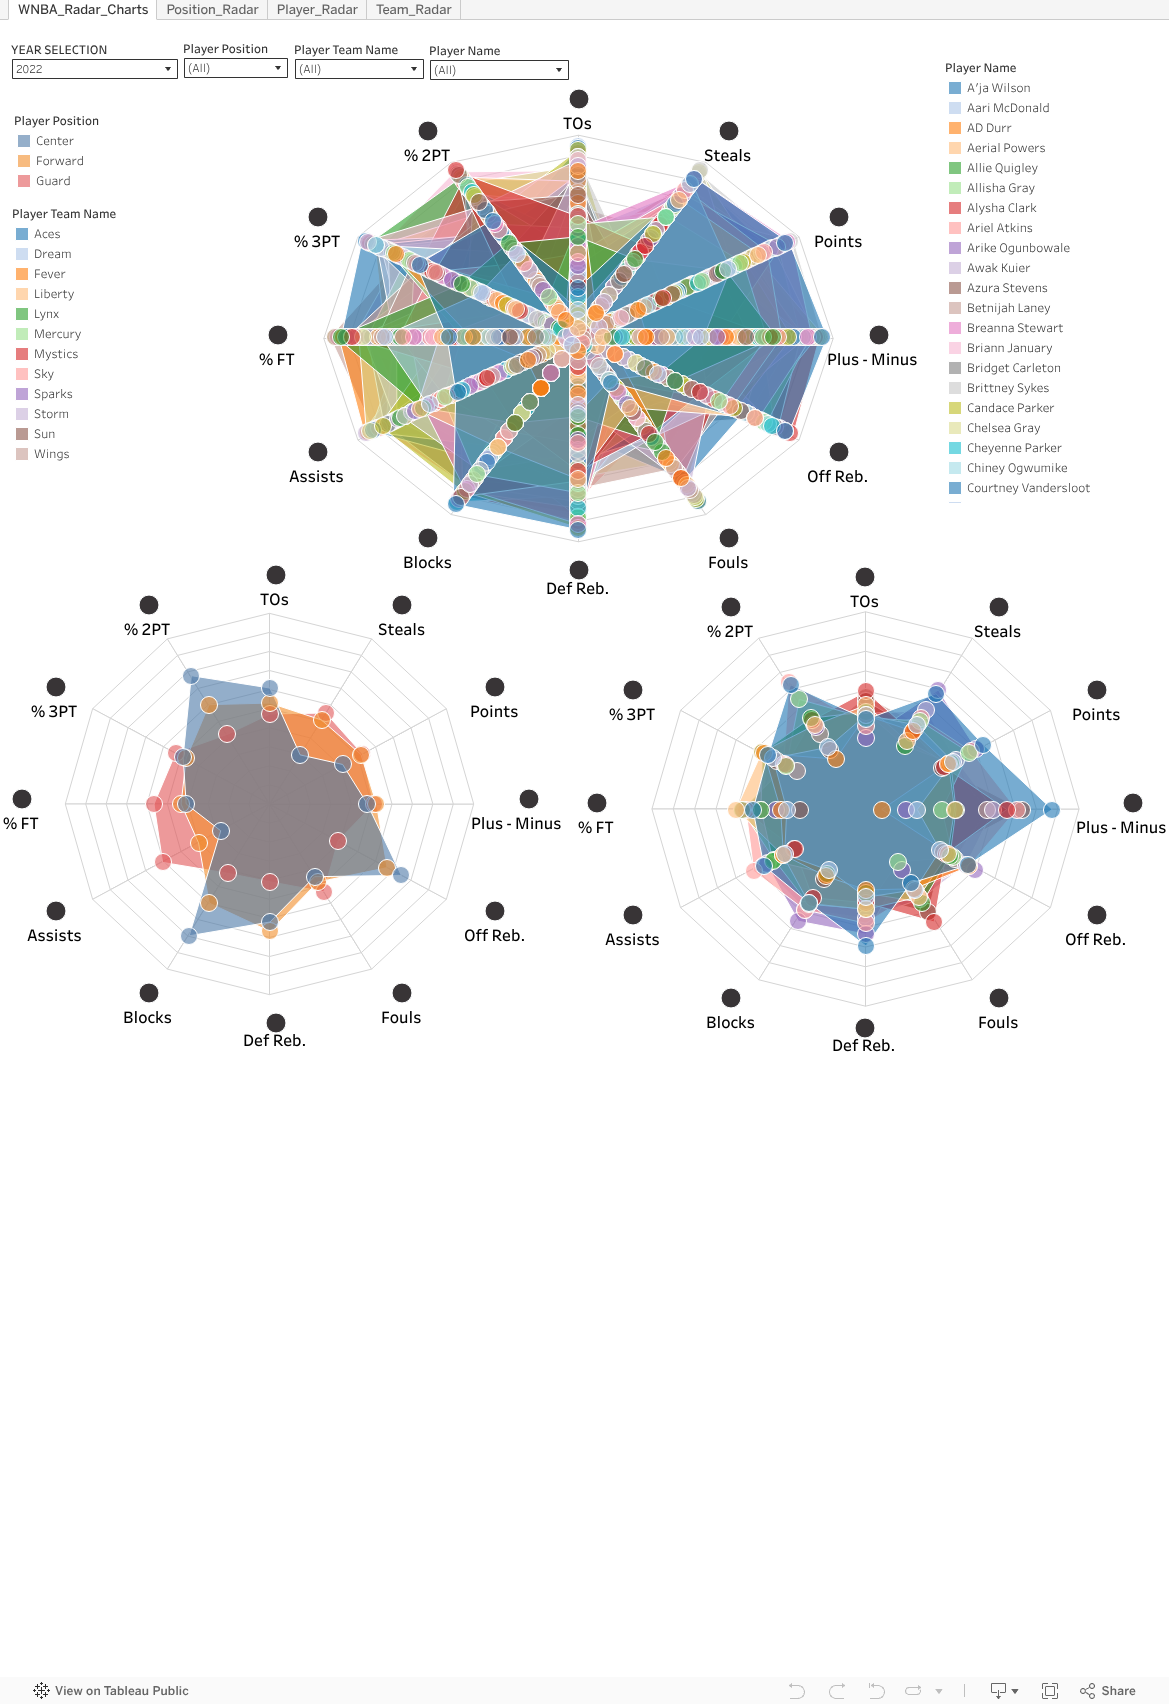
This visualization helps the player scouts & coaches evaluate their team or players against the rest of the league in the 12 key WNBA statistics of interest:
- % 2PT, % 3PT, % FT - Shooting Percentage for Free Throws, Two & Three Point Shots
- Assists - # of scoring plays assisted
- Blocks - # of Blocked Shots
- Offensive & Defensive Rebounds - # of rebounded balls following a shot
- Fouls - # of Fouls Committed
- Plus-Minus - Team Point Differential w/ Player on the Court
- Points - # of Points scored
- Steals - # of balls stolen from opposing team
A Radar Chart is a great visualization to use when evaluating multiple measures at once to evaluate where your strengths and weaknesses are. The closer each point is to the outside, the better the player, team or position is at that metric in the selected year.
There are four tabs available on the dashboard and all of them have filters that are linked together:
- WNBA_Radar_Charts - Tab includes a three radar charts that are filterable by year, player, position and team
- Position Radar, Player Radar, Team Radar - Dedicated tabs to view one radar chart at a time.
How to use the Radar Charts:
- First, use the drop-down menu to select the year you’d like to study
- Next, use the drop-down menu filters for player name, team, and position to perform comparative analyses
- Once you have filtered to the categories of interest, scroll over the points of interest to find out more information about particular statistics such as percentiles vs. the rest of the league or raw statistics