The indicators in this category examine the financial backing put towards the support of a low-carbon economy, as well as the risks associated with climate change that can affect economic growth and financial stability.
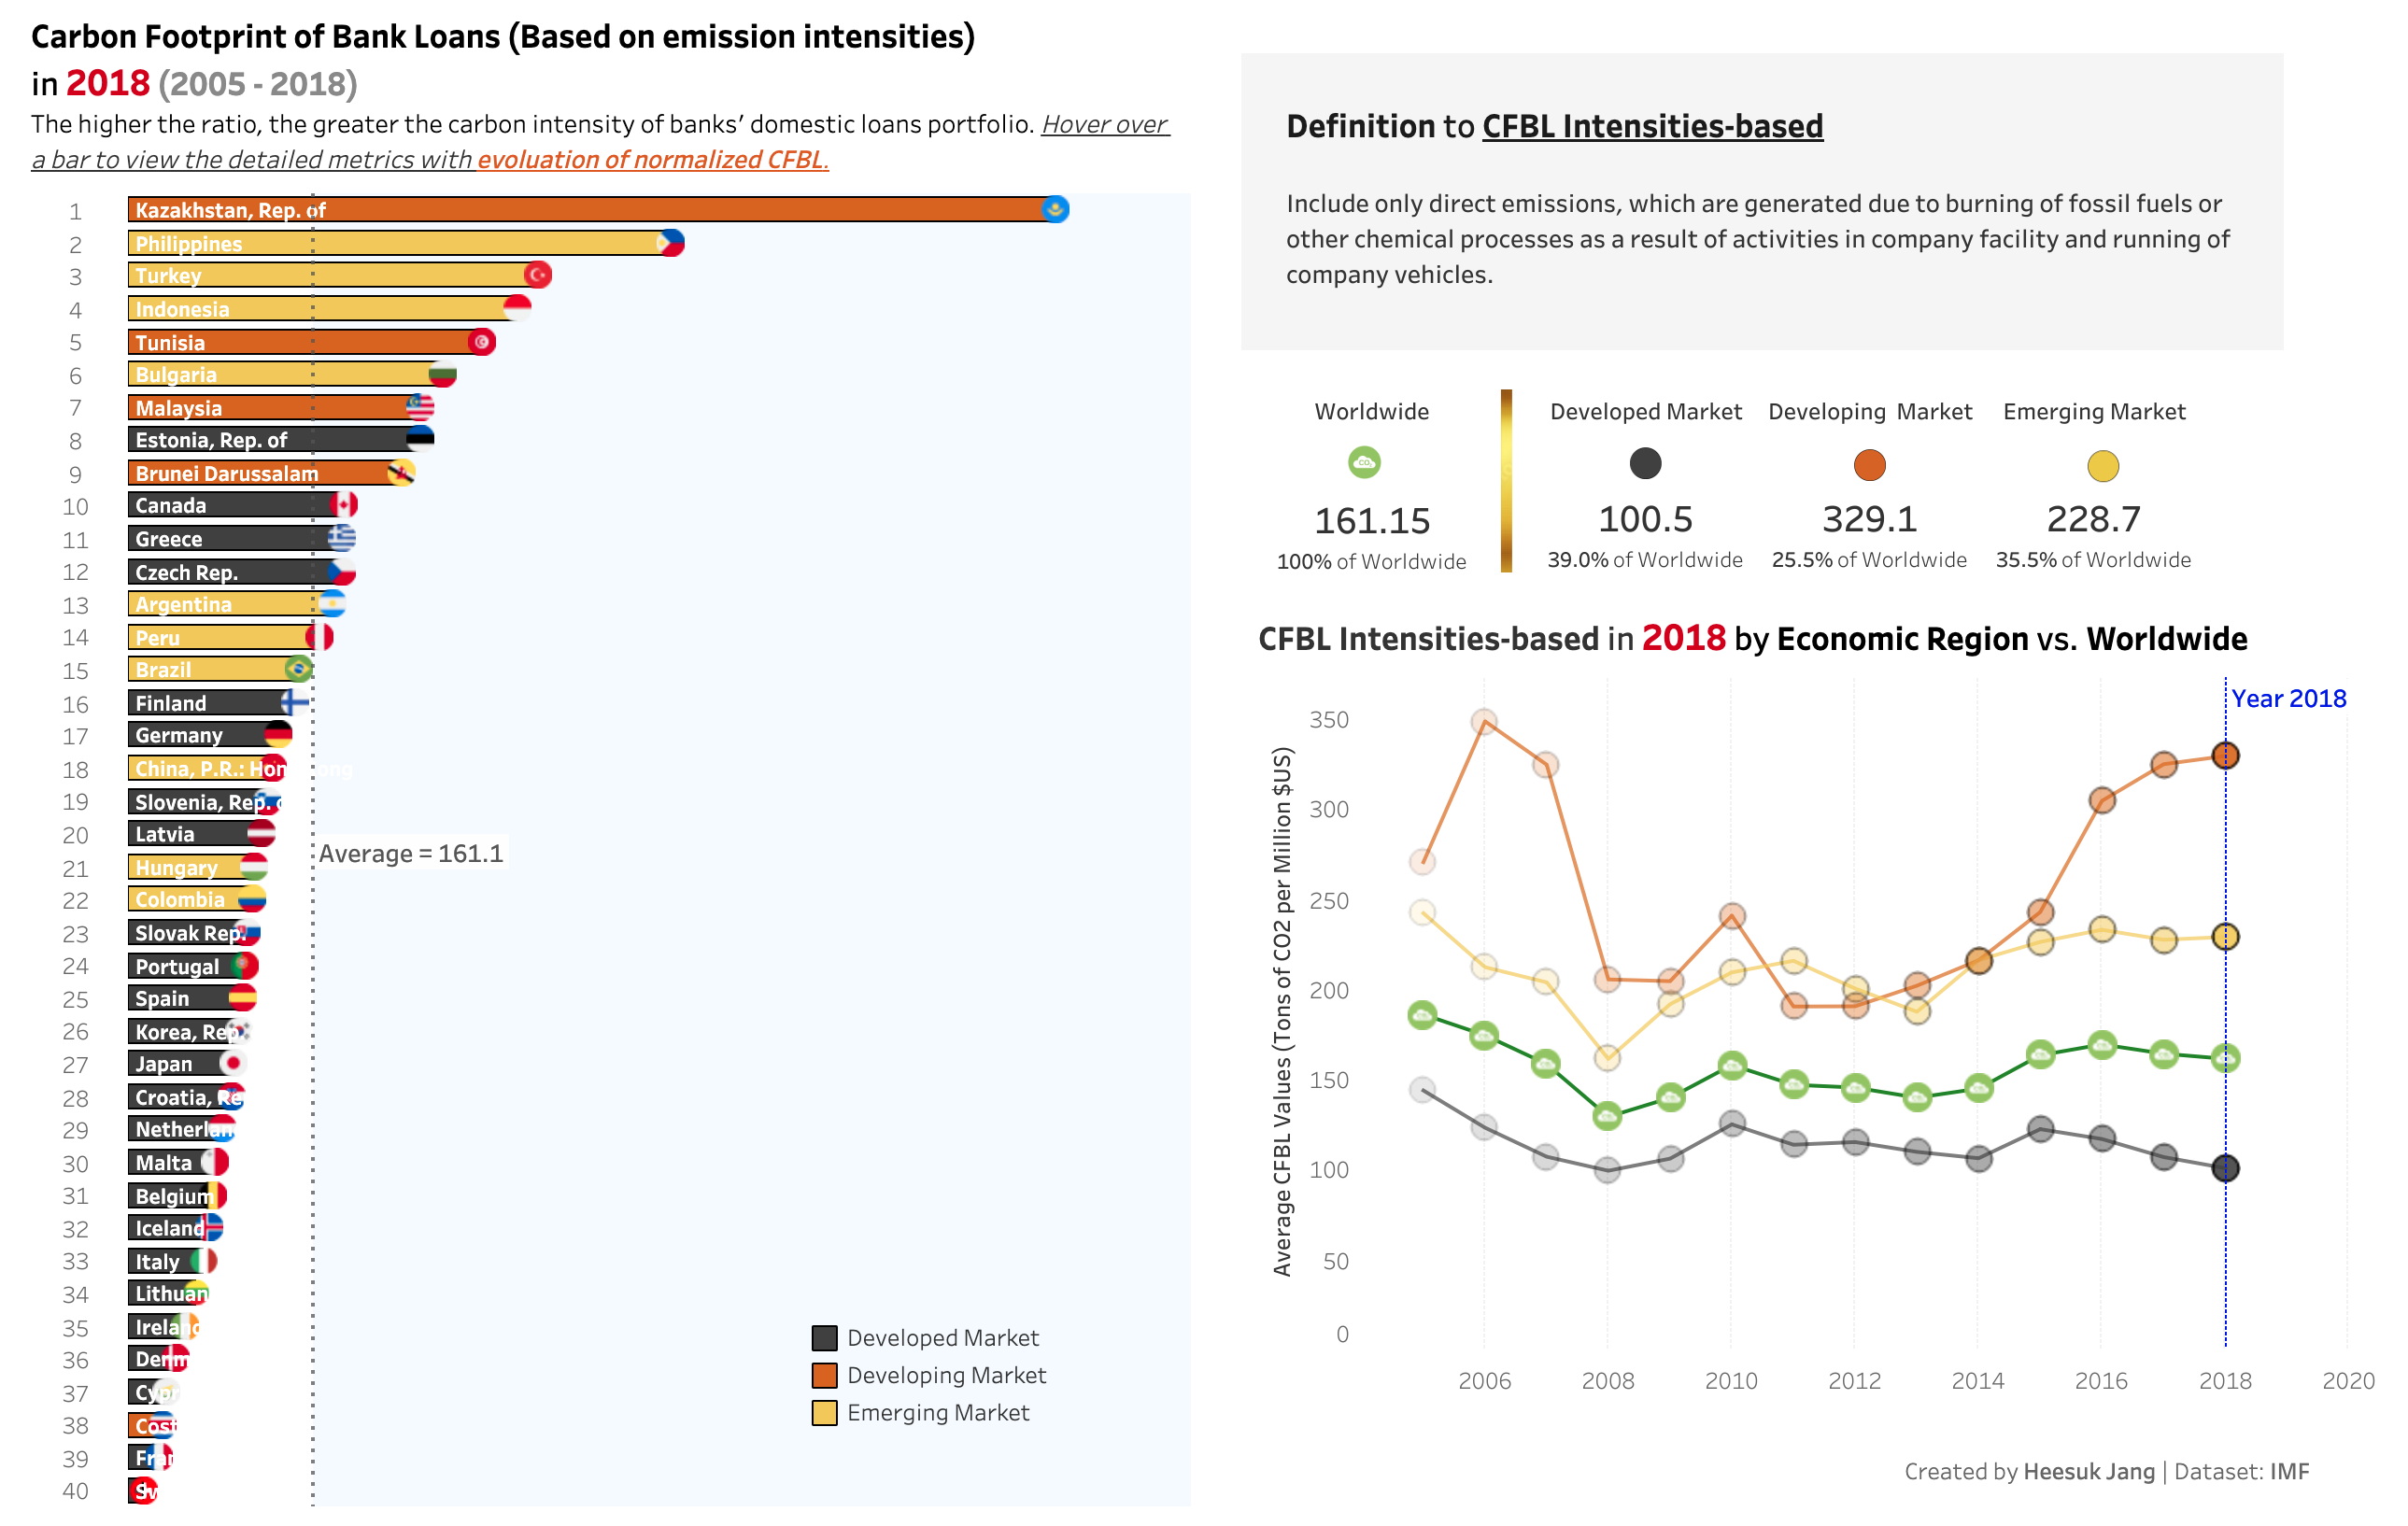
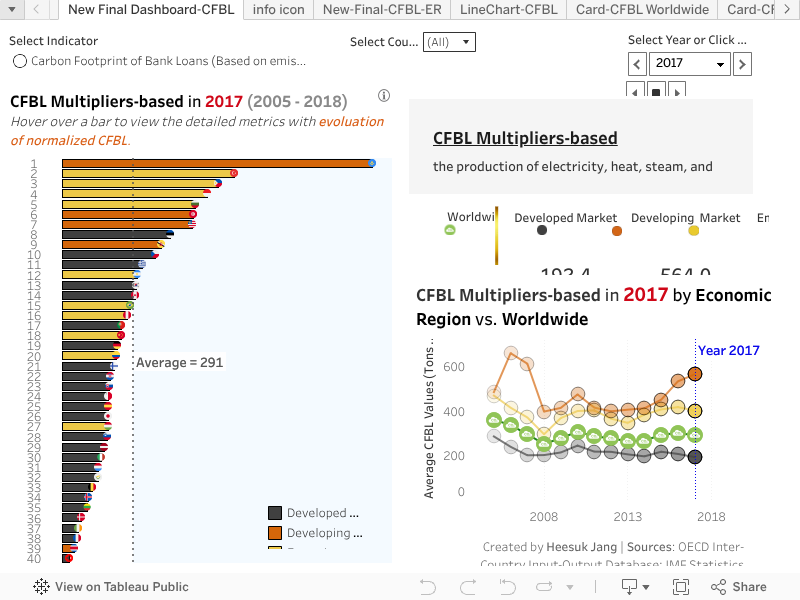
Carbon Footprint of Bank Loans (CFBL)
Quantify the exposure of a country’s banking sector to climate transition
risks.
Carbon Footprint of Bank Loans (CFBL) by Country and Year 2005 - 2018
Transitioning towards a low carbon economy, we capture the exposure of banks to transition risk via Carbon Footprint of Bank Loans (CFBL). The CFBL indicator is constructed as a weighted average of country-level emissions intensity factors of the sectors to which loans are made. The charts below illustrate the trend over time by country and economic region from 2005 to 2018 in two dimensions – intensities-based, which includes only direct emissions from burning fossil fuels or other chemical processes and multipliers-based, which comprises both direct and indirect emissions.
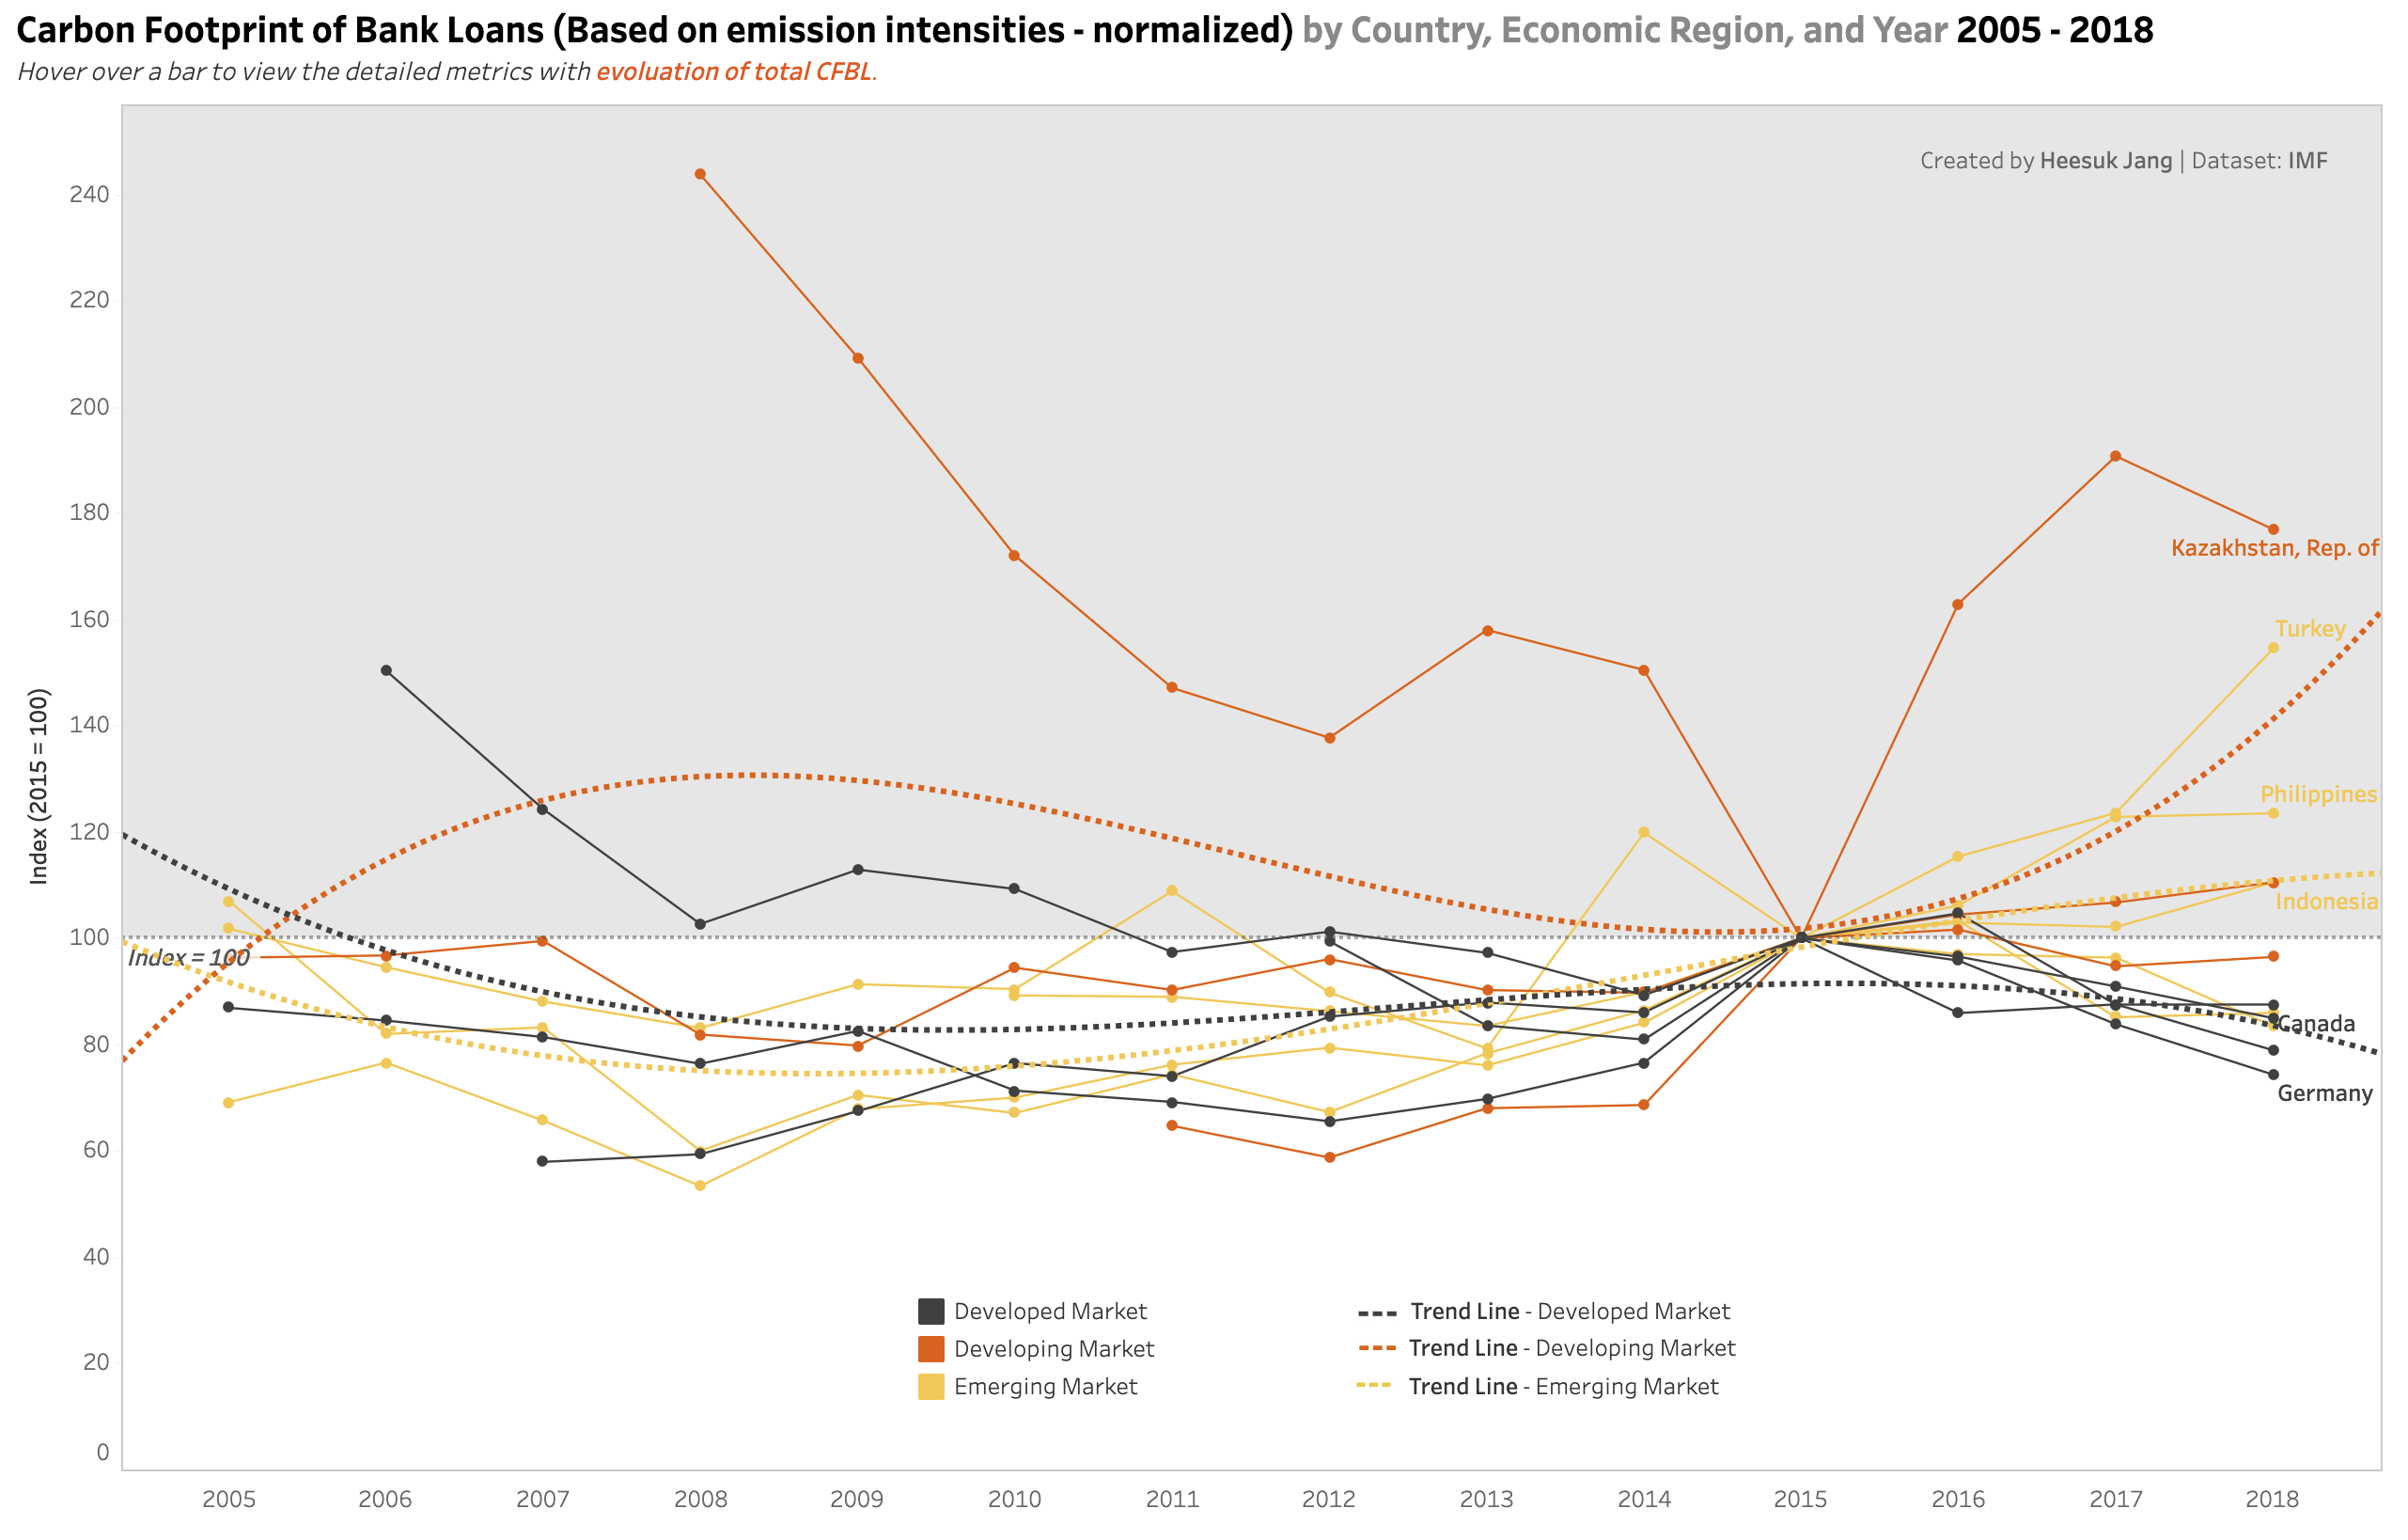
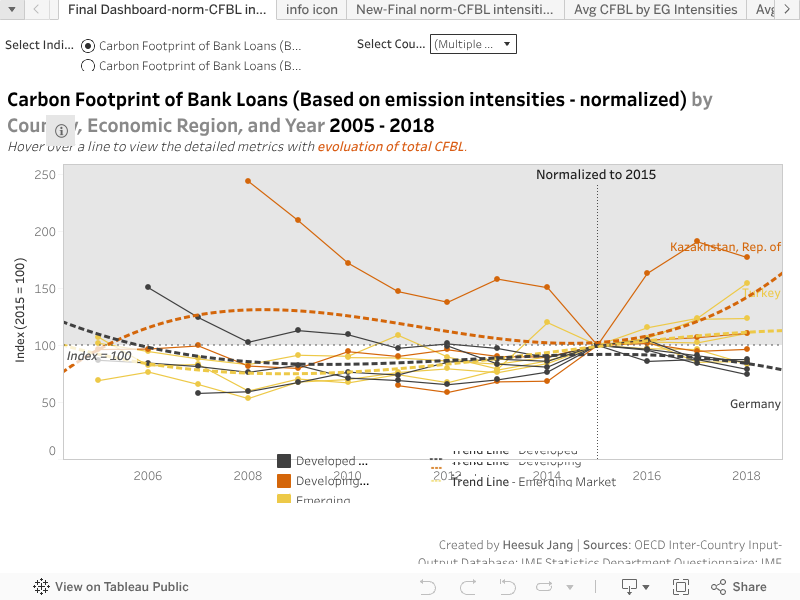
Normalized Carbon Footprint of Bank Loans by Country, Economic Region, and Year 2005 - 2018
The normalized CFBL is designed to facilitate easy assessment of the evolution over the years of the carbon content of loans, and are presented as index numbers set to be 100 in 2015, which is the year when data is available for all countries.
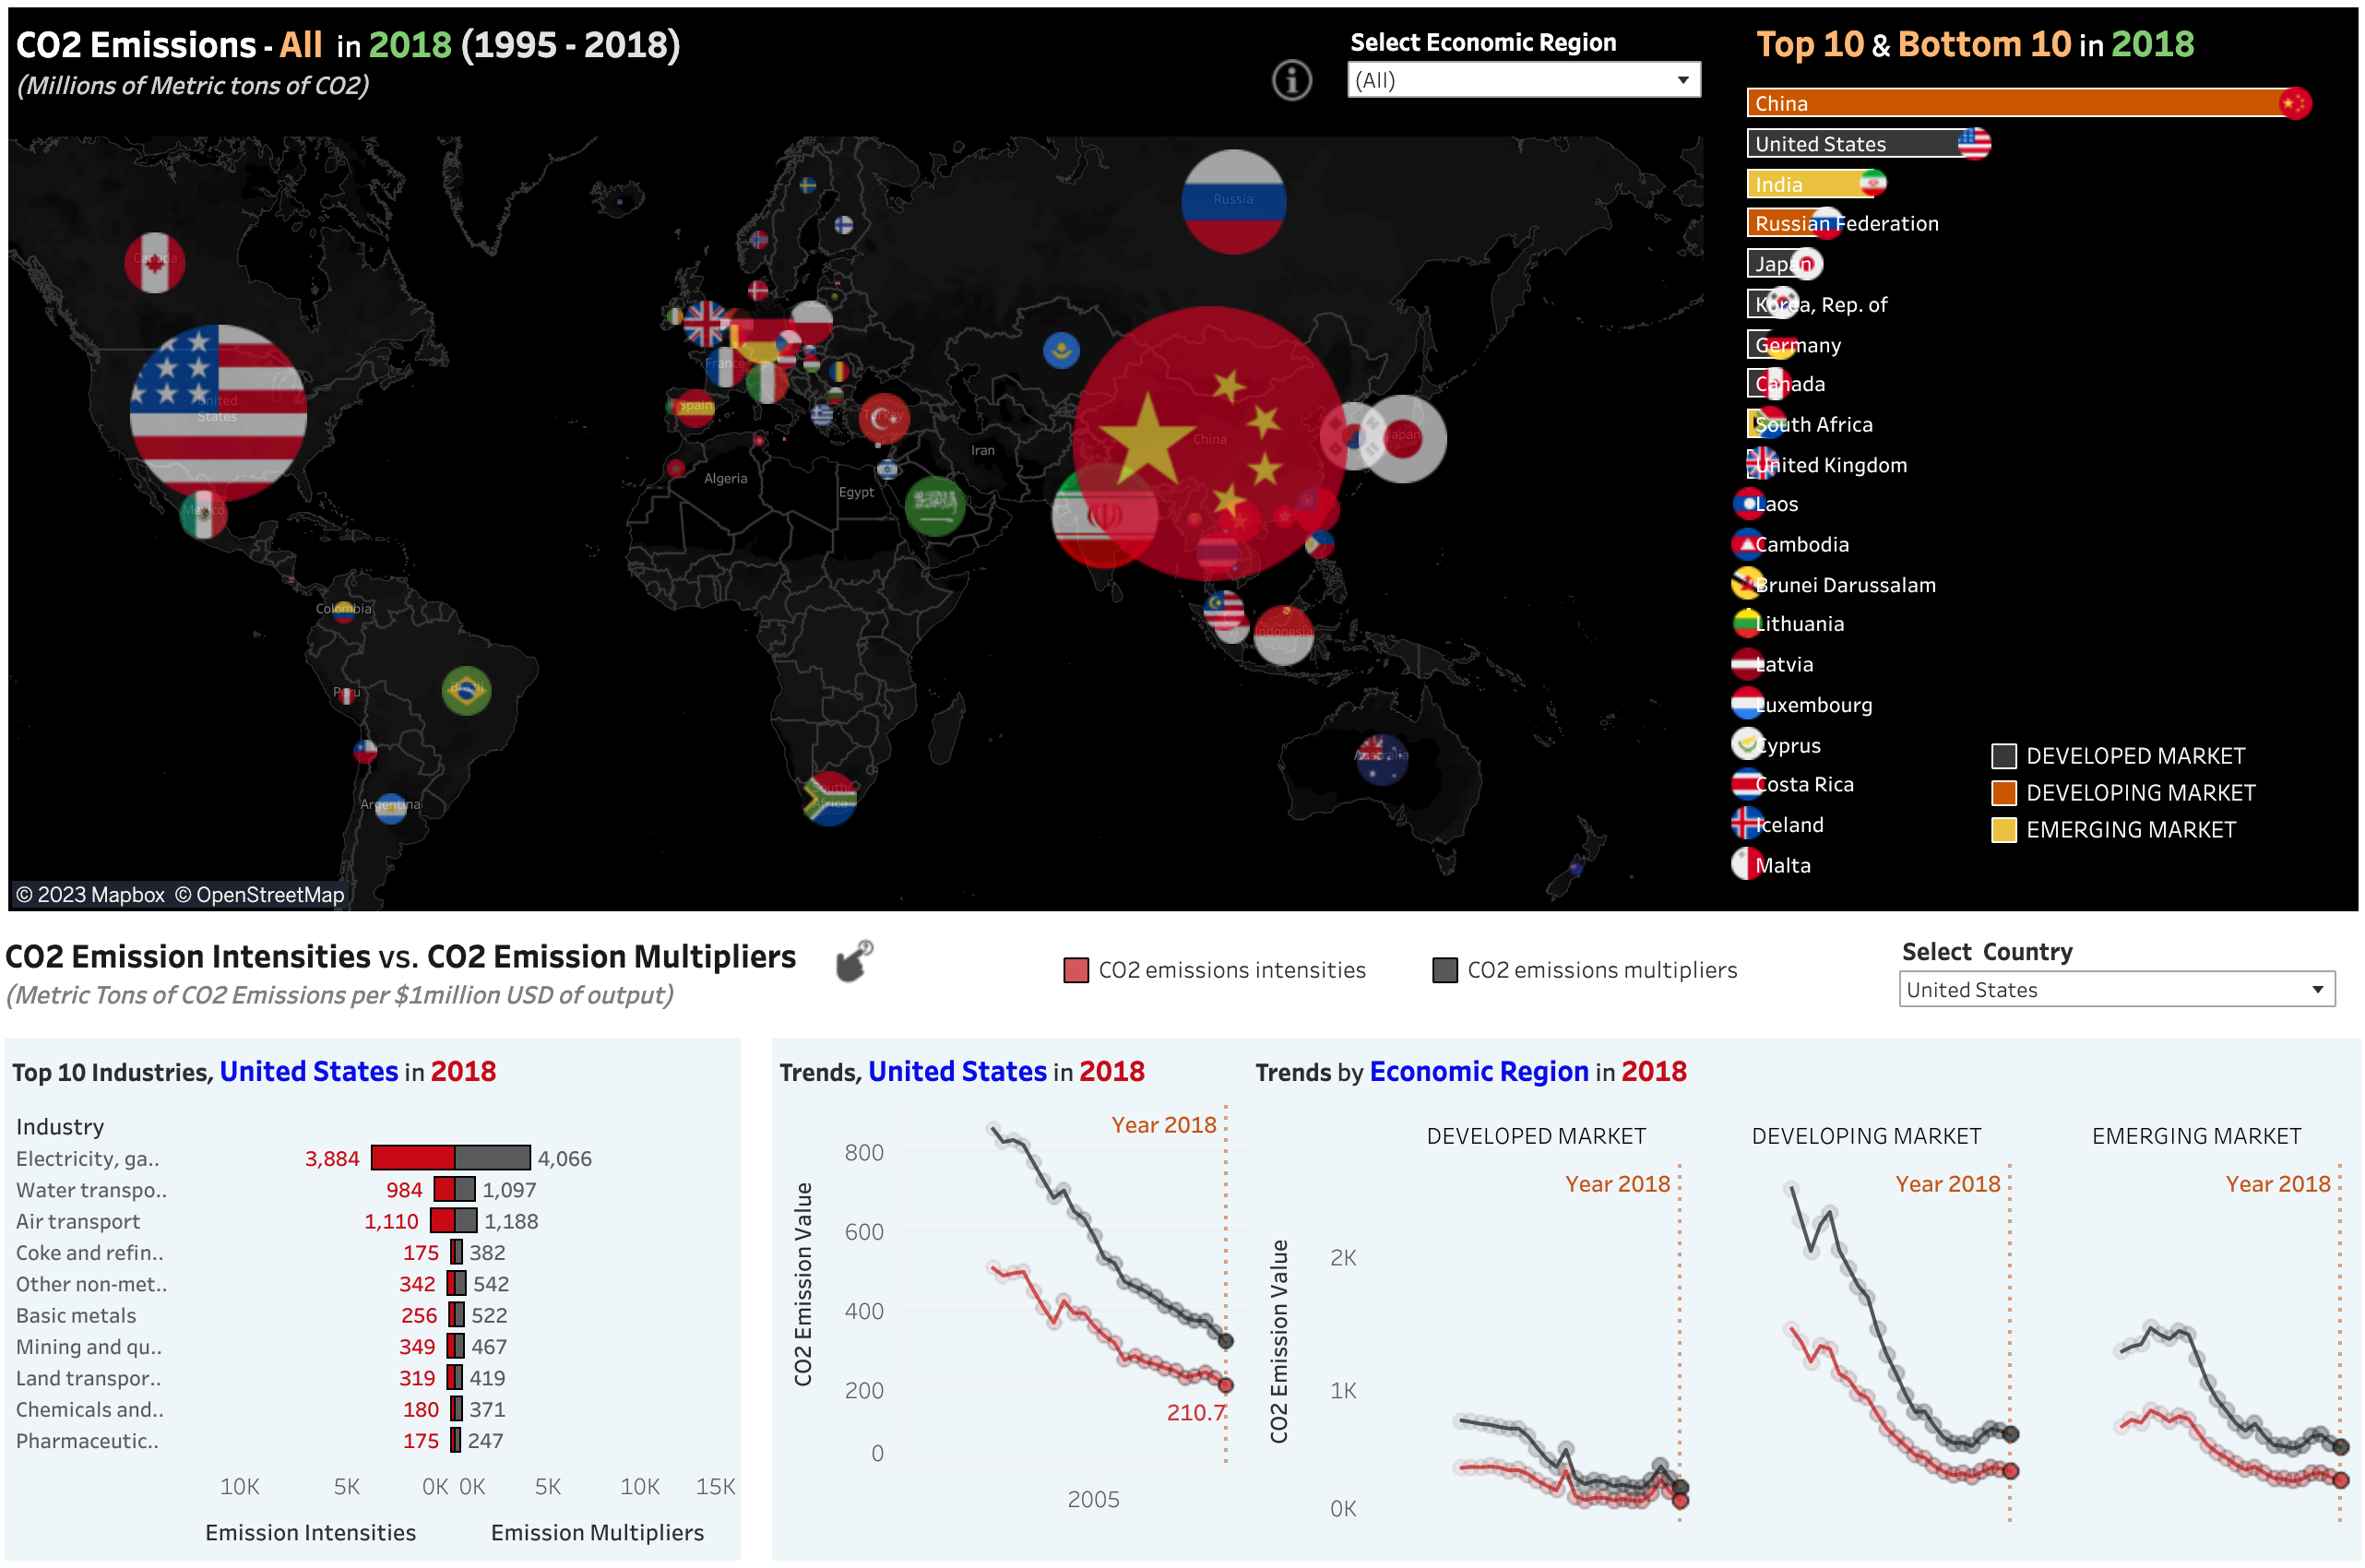
CO₂ Emissions: Emissions Intensities and Emissions Multipliers by Country, Industry, and Economic Region 1995 - 2018
The charts below illustrate how the CO2 emissions, emissions intensities, emissions multipliers have evolved at a global scale from 1995 to 2018 thus helping users better understand the effects of the emissions of countries on CFBL. The indicator also shows the countries responsible for the highest volume of CO2 emissions multipliers based on the year, economic region, and industry selected. Click the hand-shaped icon to find definitions for the emissions intensities vs. emissions multiplier for your information.
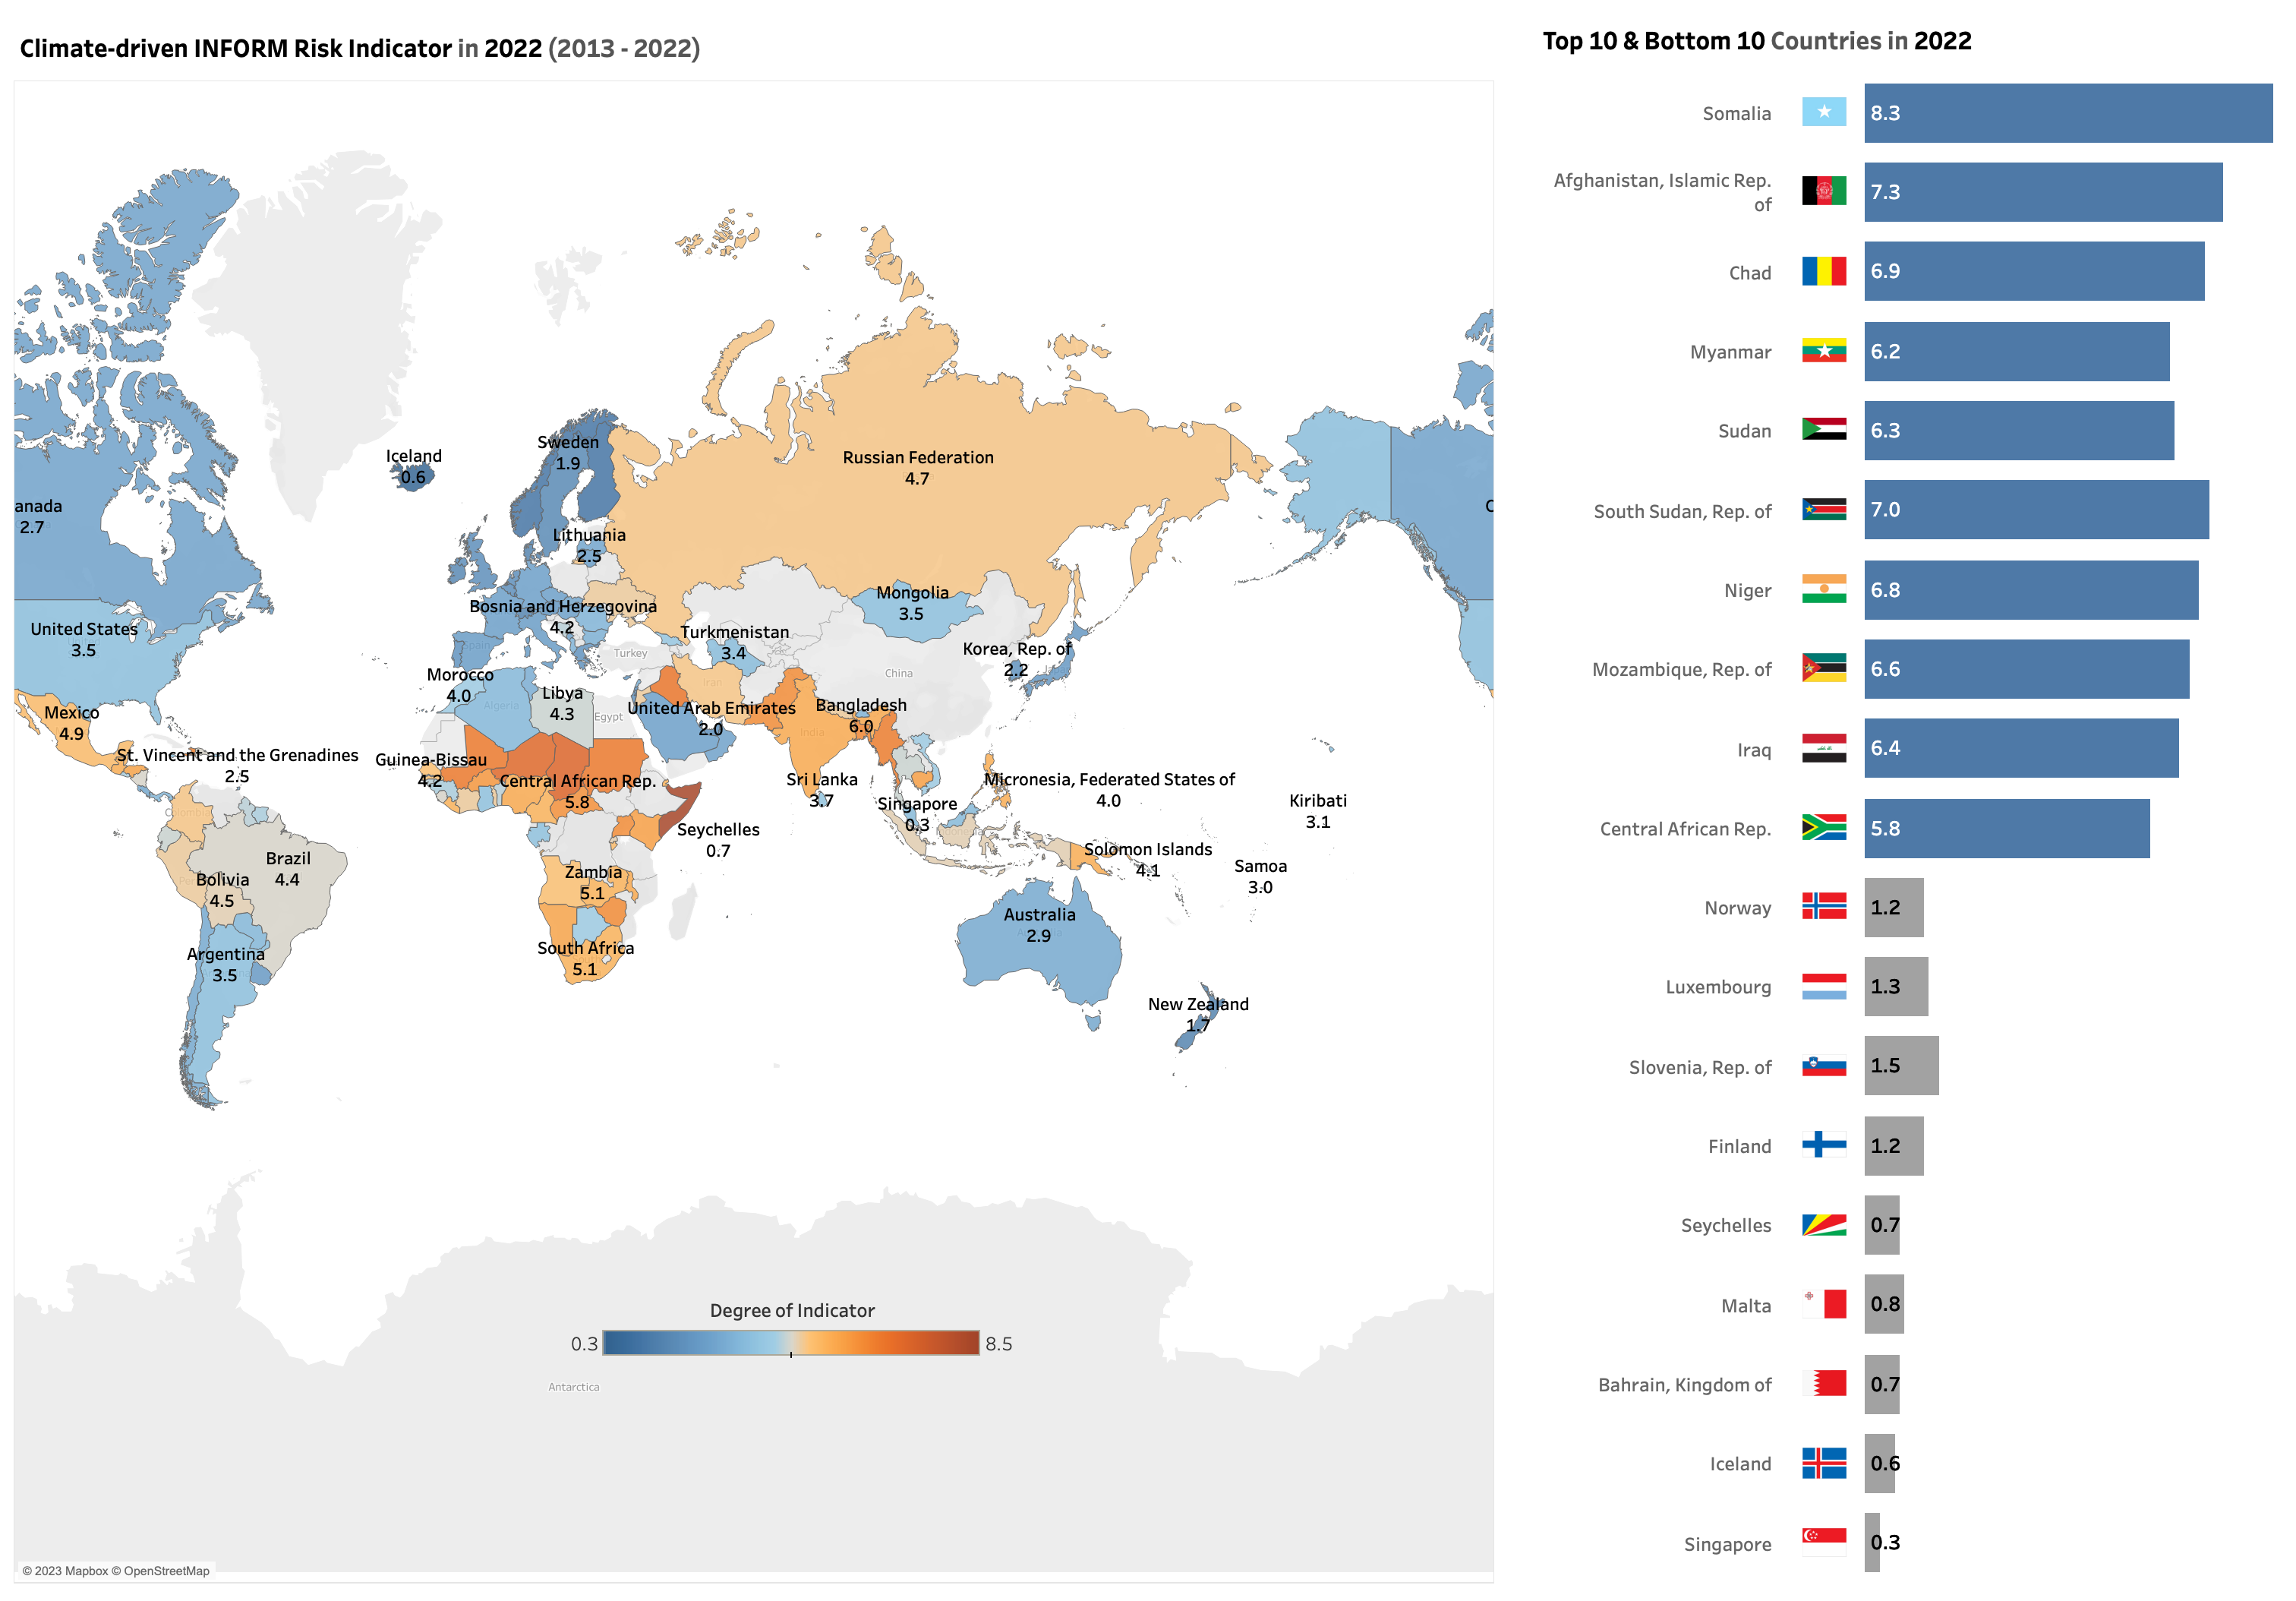
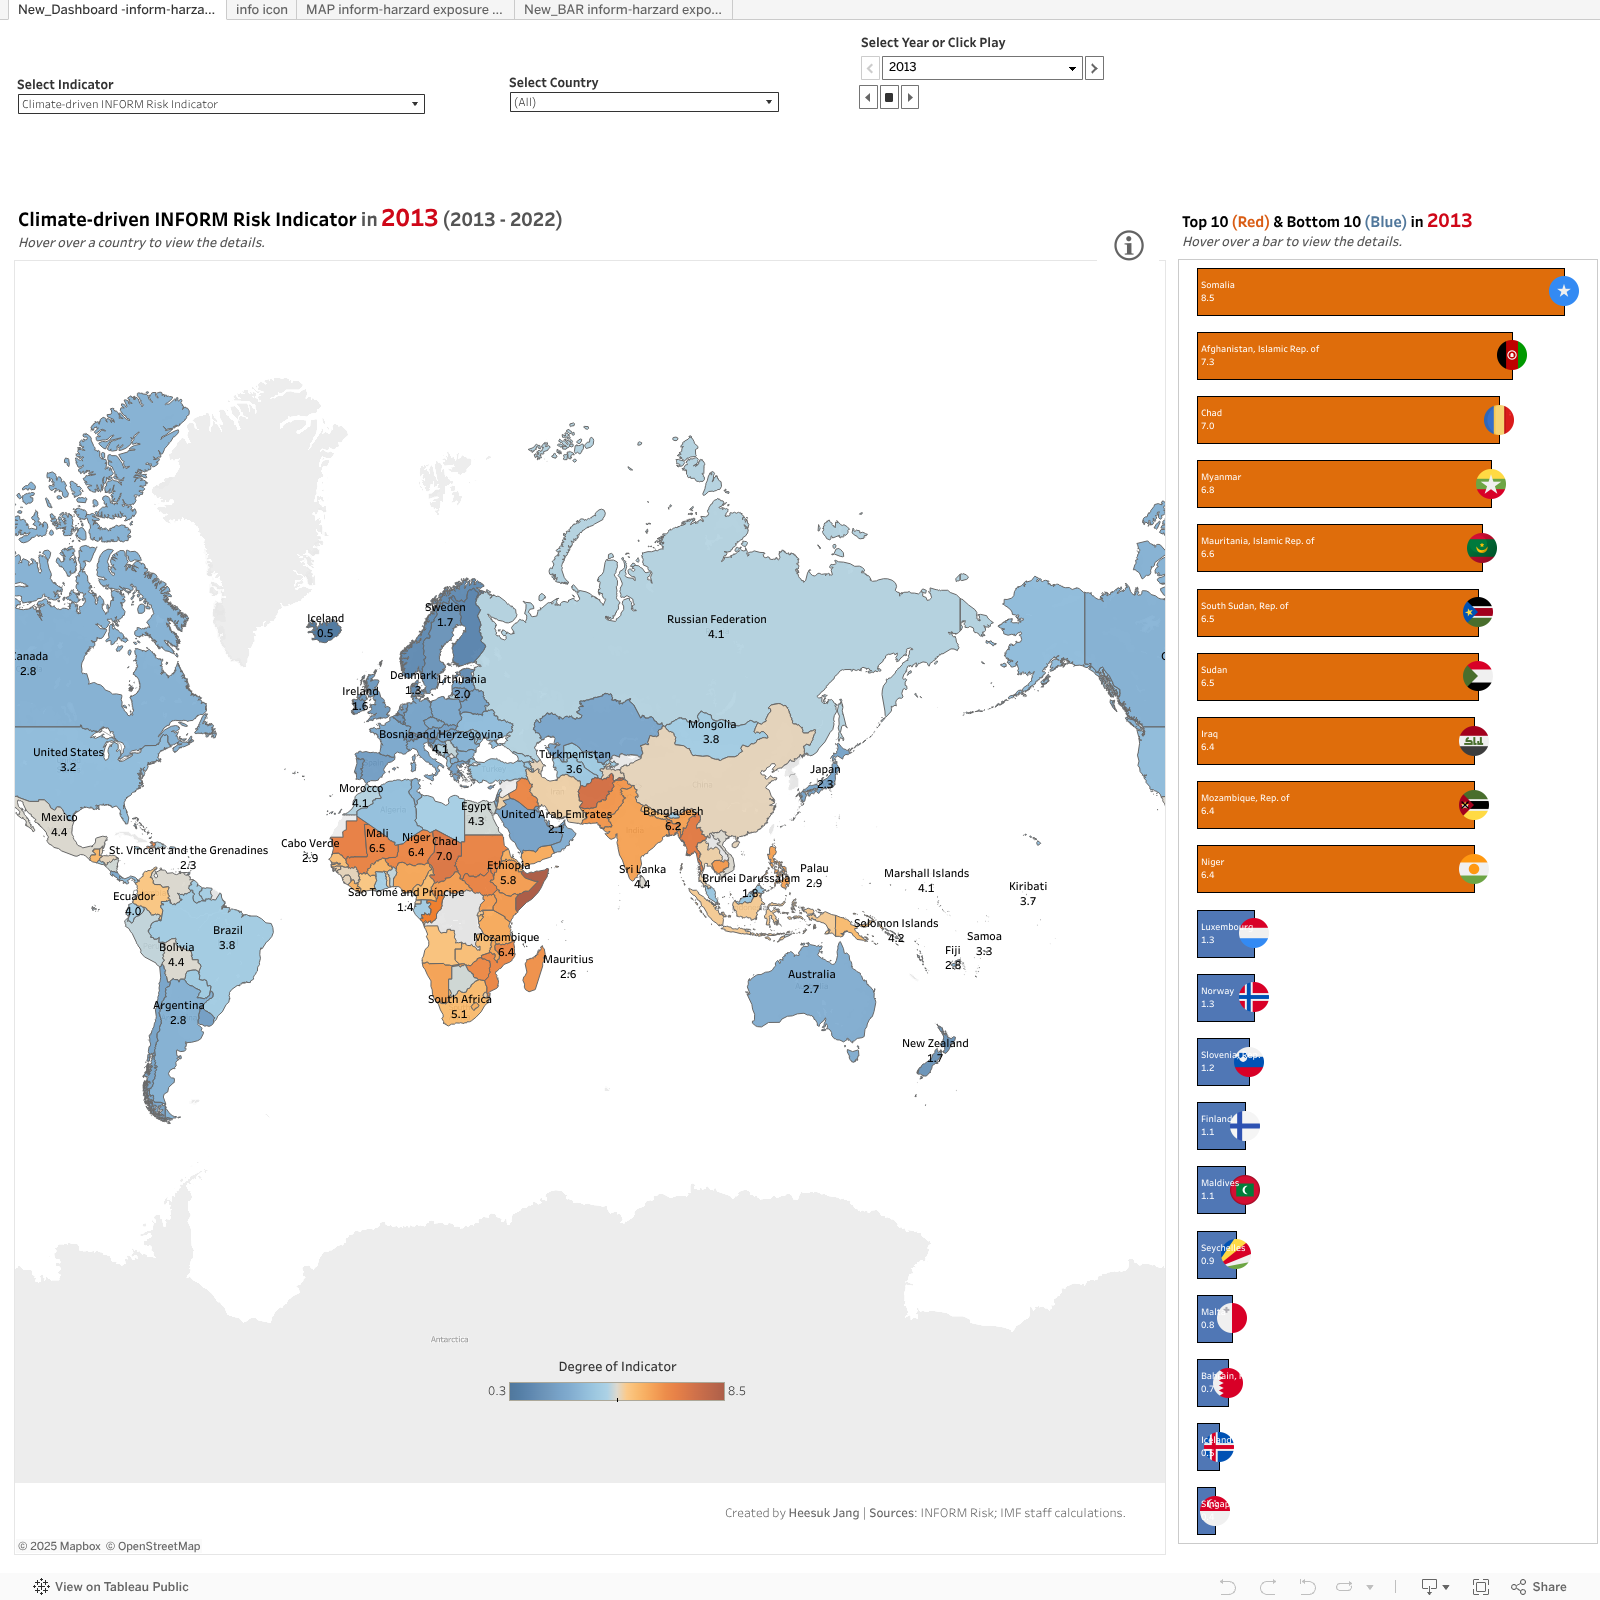
Climate-driven Physical and Transition Risks by Country and Year 2013 - 2022
The charts below examine the risk for crises and disasters using the climate-driven INFORM risk indicator. This indicator comprises of three different dimensions: climate-driven hazard & exposure, vulnerability, and lack of coping capacity to support decisions about prevention, preparedness, and response, and we will assess each measure at a global scale over time from 2013 to 2022, while highlighting each dimension for top 10 and bottom 10 countries for a chosen year. Hover over the information icon for more information and what's measured by each indicator.
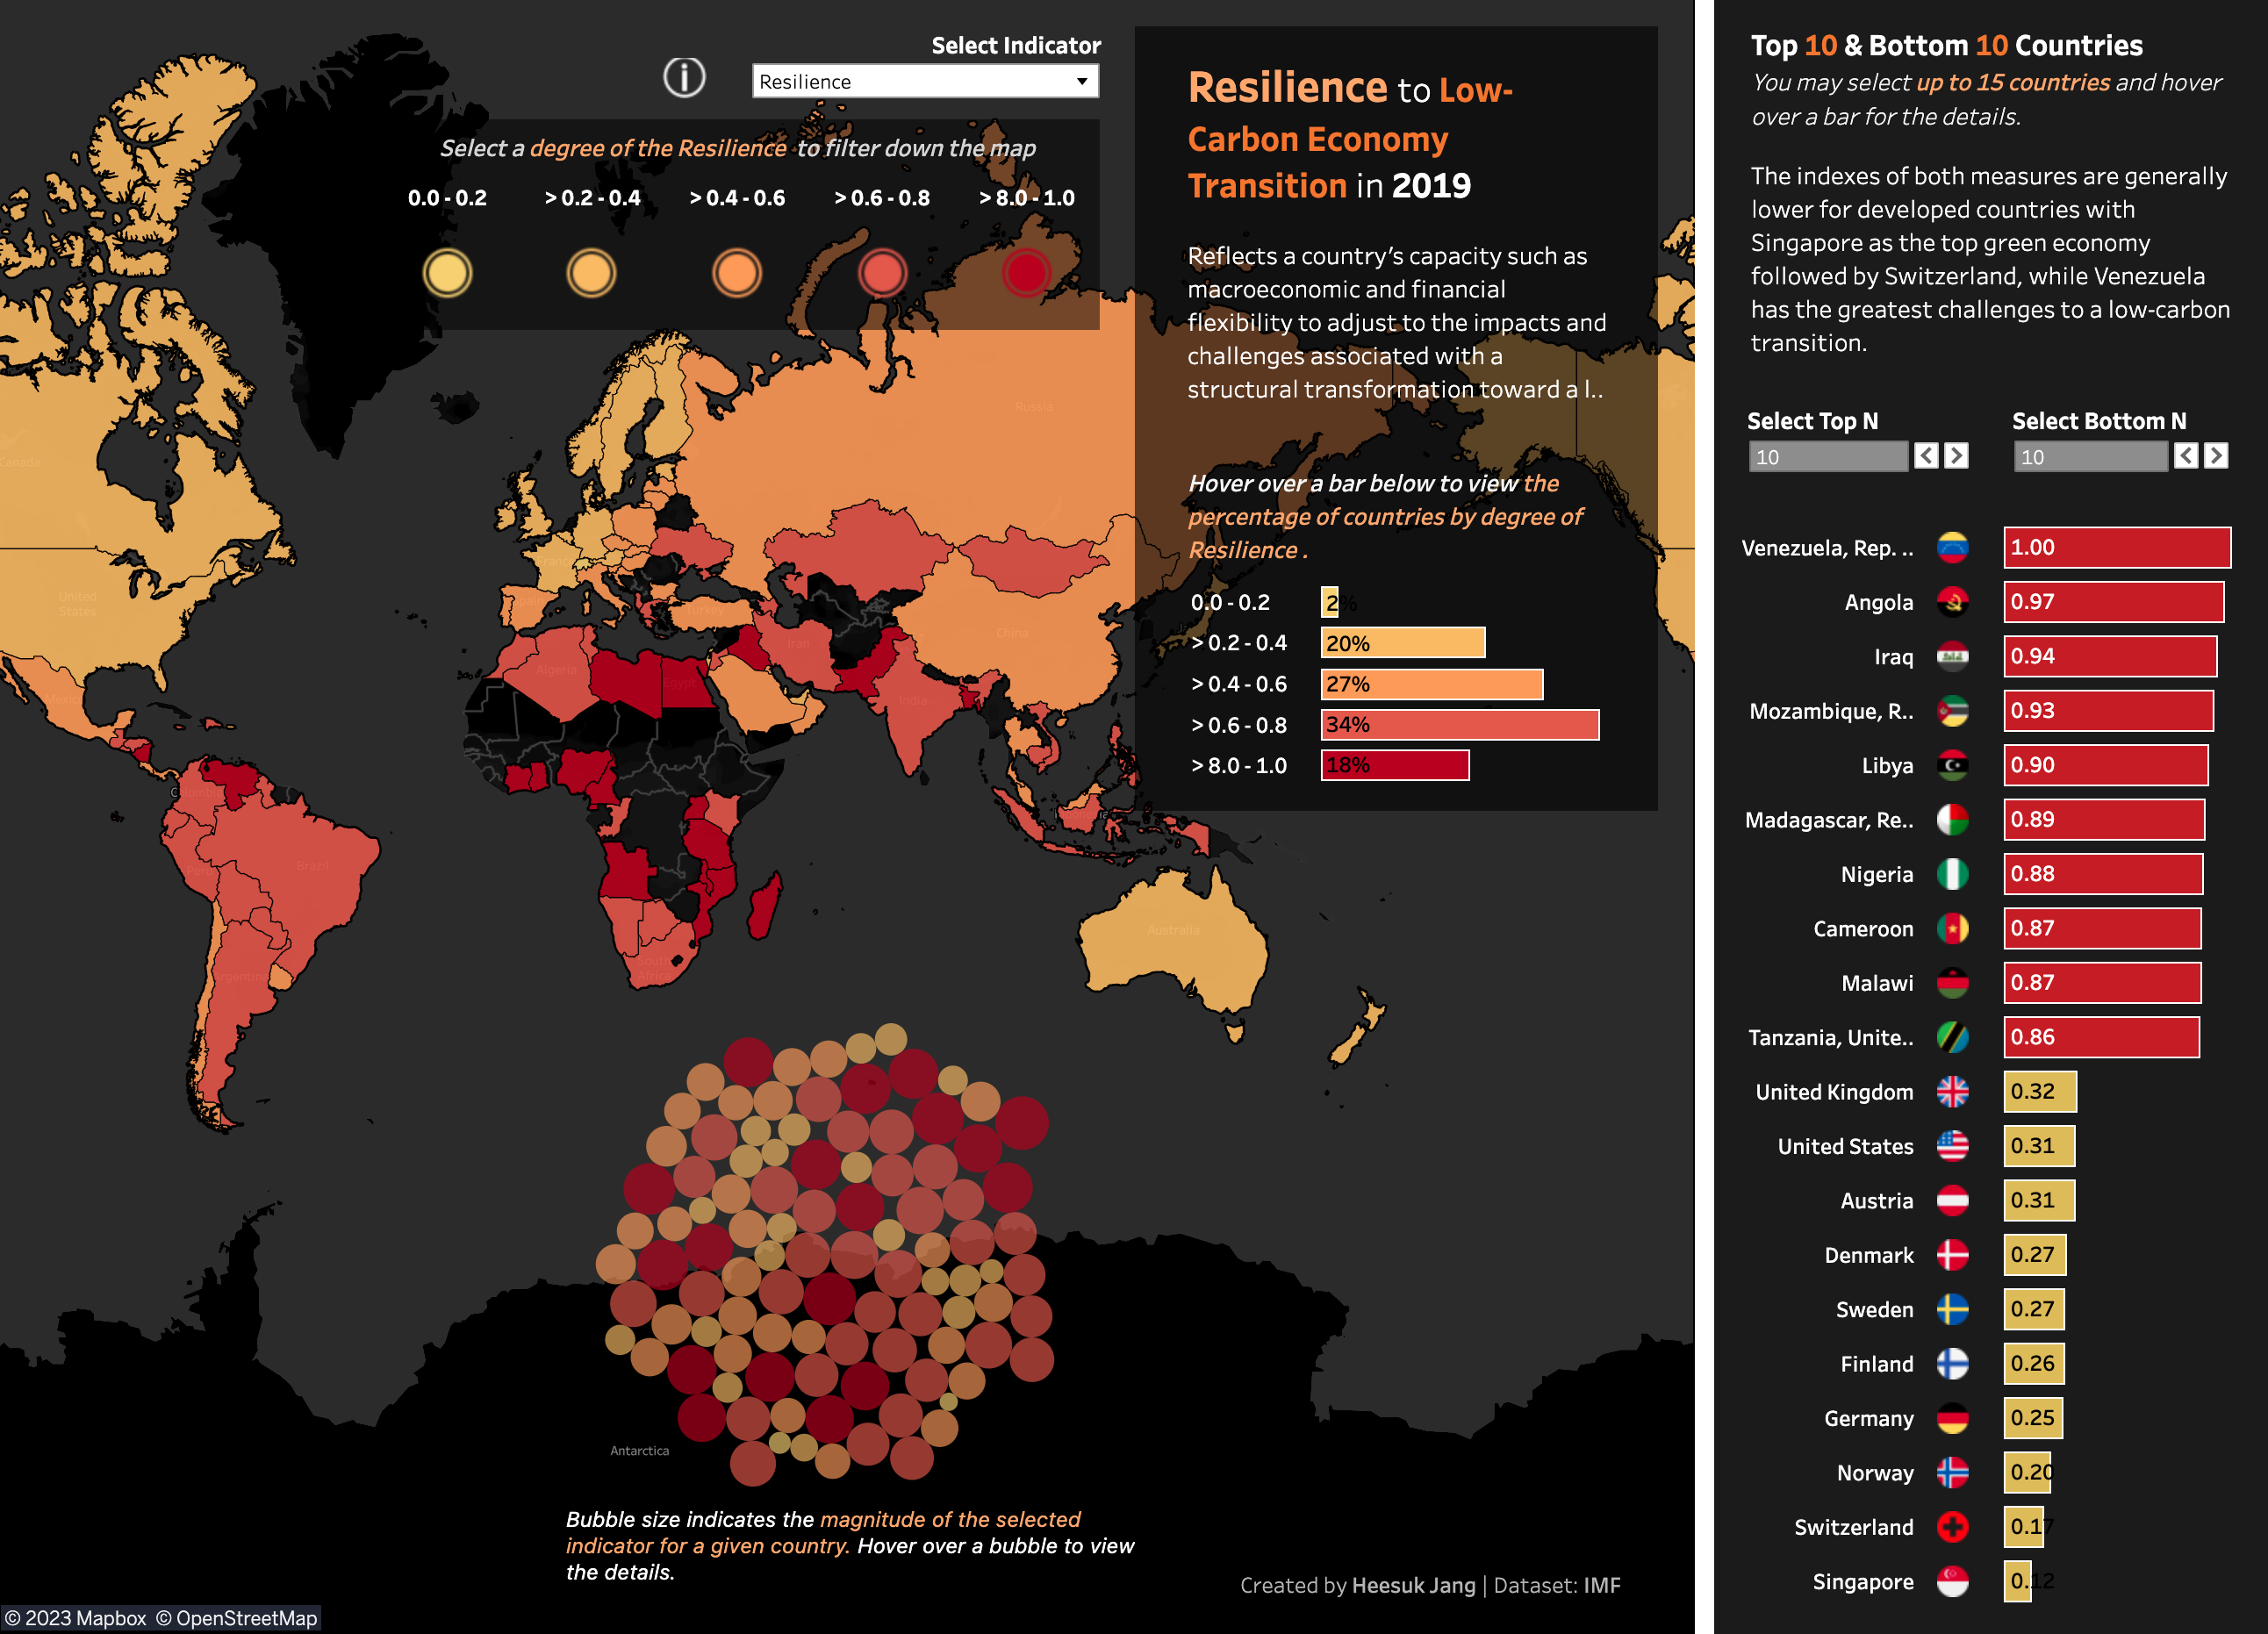
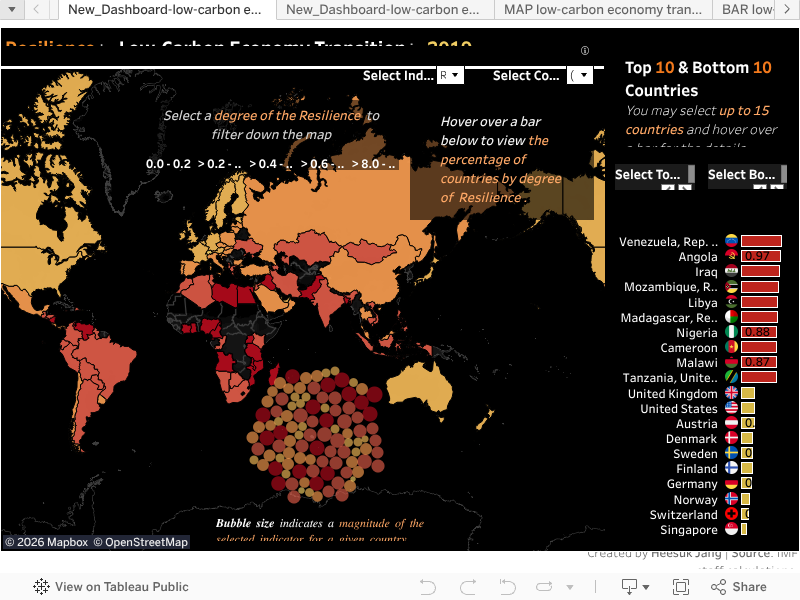
Preparedness of Countries for a Low-Carbon Transition by Country in 2019
The graphics here illustrate composite degrees of resilience and exposure in 2019, scaling from 0 to 1, with a higher score indicating lack of preparedness of countries for turning the risks of a low-carbon transition into opportunities for social, economic, and environmental development. Darker red indicates fossil fuel-dependent countries that rely heavily on carbon-intensive revenues at present or in the future thus will likely face the largest challenges to the transition. Hover over the information icon for more information and what's measured by each indicator.
With the climate changing, governments and financial institutions are more cognizant of their environmental impacts than ever. One measure of environmental impact is the carbon footprint of bank loans. For some countries, especially developed countries, the carbon footprint is relatively low. But for developing countries, the footprints are higher. We also see that many countries are at risk of climate-change related damage and unprepared to transition away from fossil fuel energy. Decision-makers should use these insights to make environmentally conscious choices and prepare for climate change.