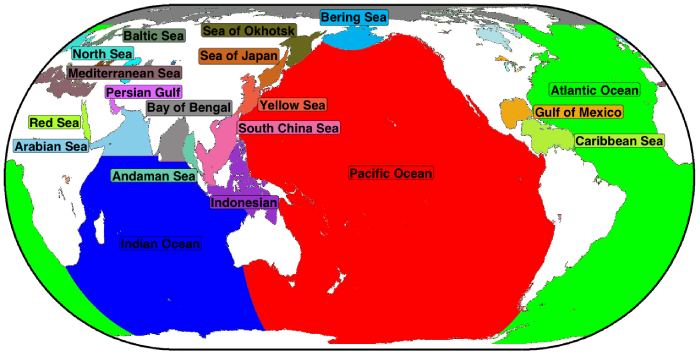
Data source

This webpage uses the change in mean sea levels data produced by the National Oceanic and Atmospheric Administration and accessed via the IMF's website. This map below, borrowed from the NOAA's website, outlines the data's sea region definitions. The data used for this website can be accessed at the below links.
IMF data
NOAA data info and map
Back to Top


Description of the image


Satellite sea level trends 1992 - 2022

The NOAA collected sea level data for this website using the TOPEX.Poseidon and Jason satellites. For all subsequent charts on this page, mean sea level changes are calculated as the average of all the satellite data available for a particular time period. As seen on the below chart, the satellites tend to cover distinct time periods, but there is some overlap. 0 on the y-axis represents the long run average for sea level as calculated by the National Oceanic and Atmospheric Administration (NOAA). Positive or negative y-axis values represent deviations from this value.
Back to Top


Total sea level change by region 1992 - 2022

This chart shows the 30-year changes in sea level by region. The world's mean sea level has increased by over 4 inches in the last 30 years, but sea levels in the South China region have increased by nearly double that amount. Rising sea levels are associated with extreme flooding, erosion, soil contamination, and lost animal habitats.
World total sea level change: 3.9 inches
Mean annual change: .13 inch/year
Highest regional change: South China Sea, 7.97 inches

Back to Top

Annual sea level trends 1992 - 2022

This chart allows you to view annual mean sea level trends for a particular region over the last 30 years. There are several years for which average sea level decreases for a particular region, but total sea level has increased for each region from 1992 to 2022. Back to Top


Weekly sea level trends 1992 - 2022

This chart allows you to see weekly sea level trends for the Atlantic, Indian, and Pacific Oceans. Weekly data is largely influenced by seasonality: world sea levels tend to peak in October and are at their lowest in May.
Back to Top


Conclusion

This tab provides an overview of the regional and time period consistency of average sea level rises. Sea level rises have far-reaching consequences, leading to environmental disasters and financial damages which pose a significant threat to our planet. For more information on temperature change, climate disasters, and the financial impact of climate change, we encourage you to explore the other tabs on this website.