Climate change affects every individual and community across the country, but the extent of these effects varies across regions. More frequent and intense extreme weather and climate-related disasters are expected to continue, creating new risks and worsening existing vulnerabilities in communities.
Annual Temperature Change
Visualizing the raising trend of annual Temperature changes
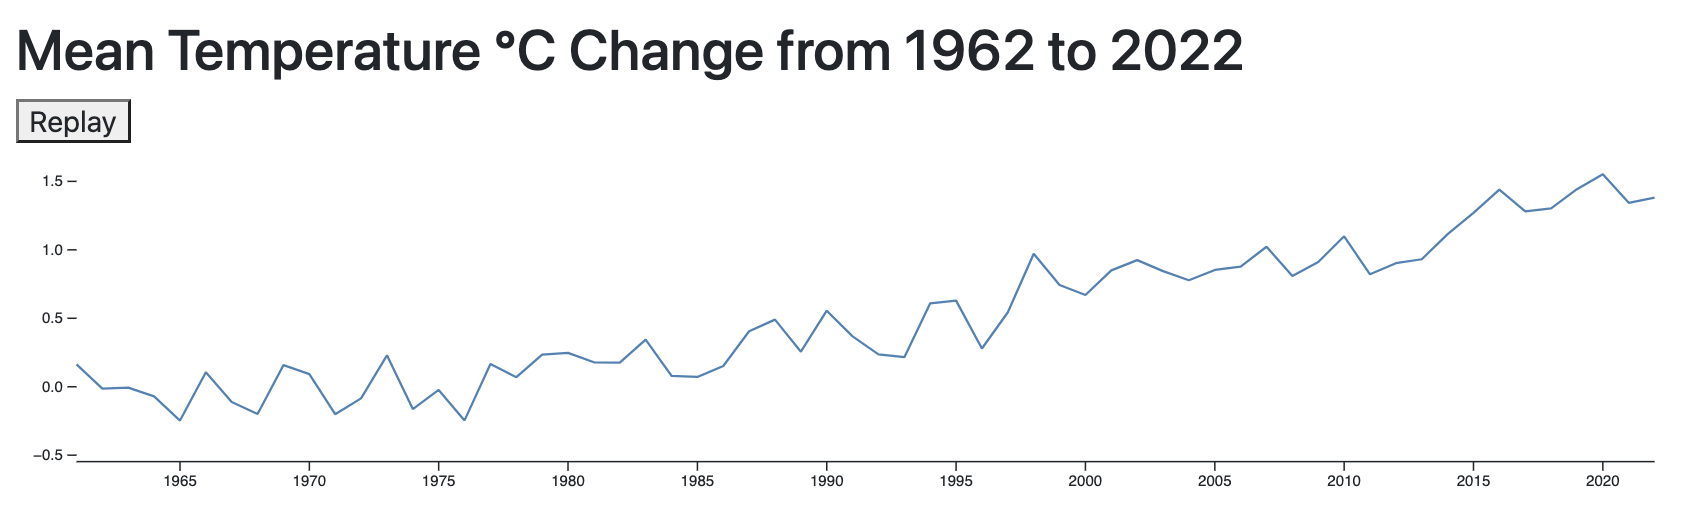
Annual Surface Temperature Change Year 1962 - 2022
This indicator below presents the mean surface temperature change during the period 1961-2022, using average temperatures between 1951 and 1980 as a baseline. This data is provided by the Food and Agriculture Organization Corporate Statistical Database (FAOSTAT) and is based on publicly available GISTEMP data from the National Aeronautics and Space Administration Goddard Institute for Space Studies (NASA GISS).
The data points on the graph are connected by a line, showing the overall pattern of temperature increase. The line slopes upward, indicating that the surface temperature is consistently rising over the given time period. The graph serves as a visual representation of the long-term increase in temperatures observed in many parts of the world.
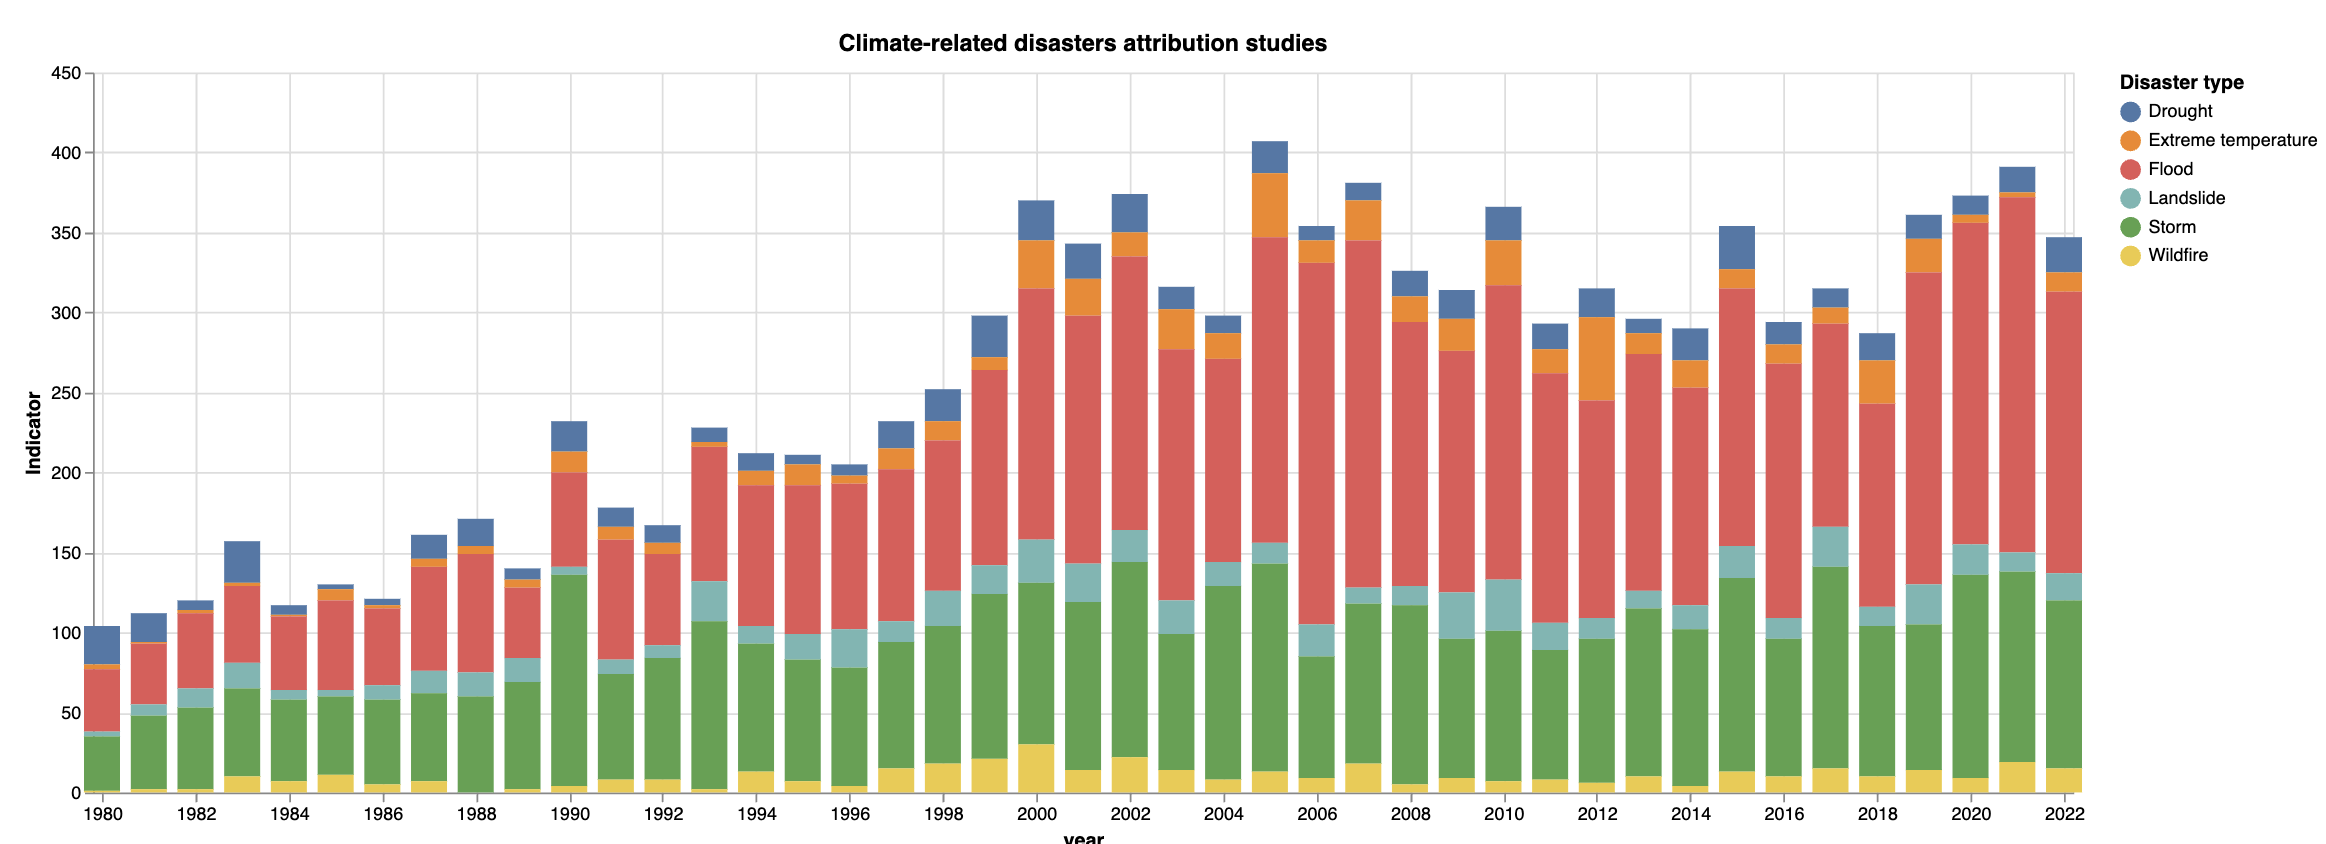
Climate-related Disasters Frequency Year 1980 - 2022
The bar chart demonstrated the trend in these climate-related disasters over time. The data source for the information is EM-DAT , which stands for Emergency Events Database, maintained by CRED (Centre for Research on the Epidemiology of Disasters) at UCLouvain in Brussels, Belgium.
Combining the evidence over the past 40 years, as the chart below shows, the frequencies of extreme events studied has grown substantially over the past 10-15 years. Specific types of event can be displayed in the chart below by clicking on the category names on the right.
Temperature and Climate-related disasters
With increasing global surface temperatures the possibility of more droughts and increased intensity of storms will likely occur. As more water vapor is evaporated into the atmosphere it becomes fuel for more powerful storms to develop. More heat in the atmosphere and warmer ocean surface temperatures can lead to increased wind speeds in tropical storms. Rising sea levels expose higher locations not usually subjected to the power of the sea and to the erosive forces of waves and currents.
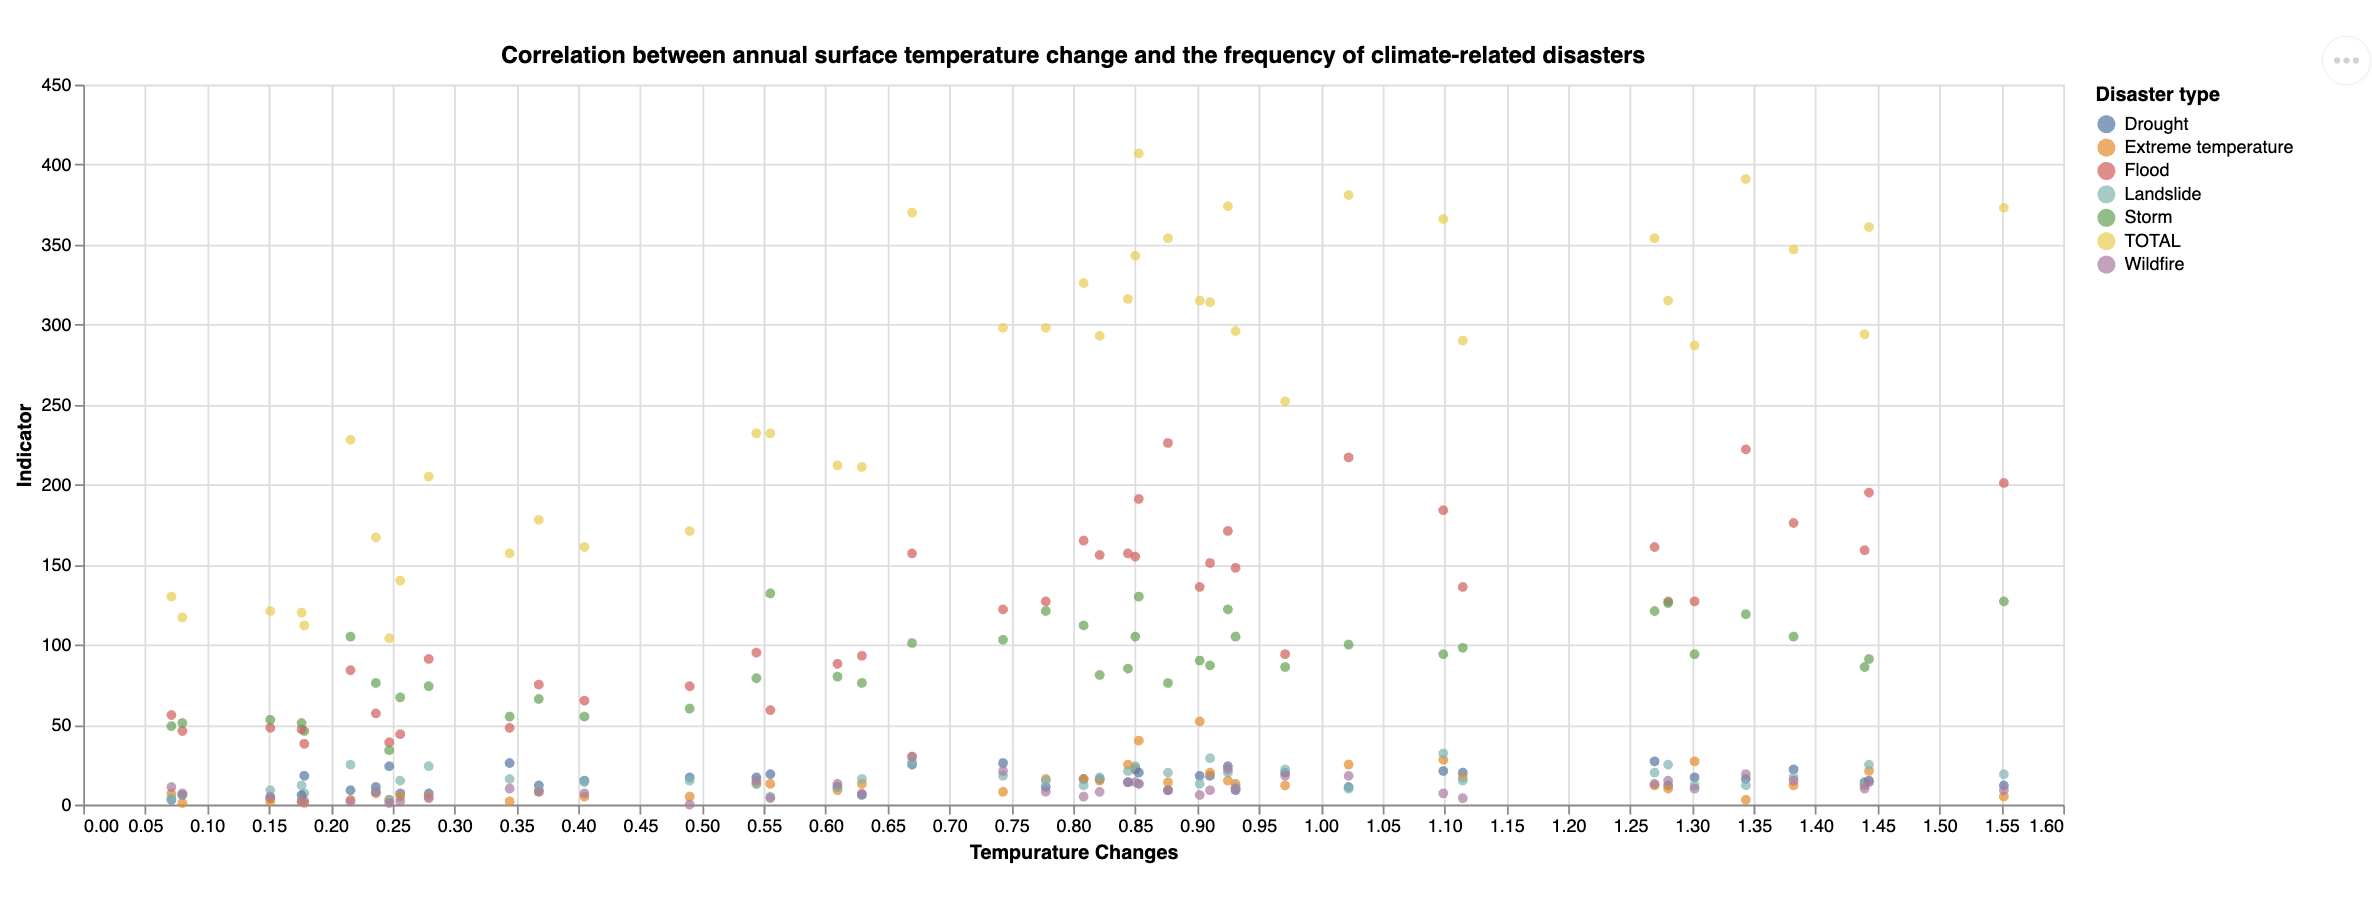
Therefore, we would like to test if there is a positive correlation between annual surface temperature change and the frequency of climate-related disasters. In more detail, as annual surface temperatures change, there will be a corresponding effect on the frequency of climate-related disasters. The rationale behind this hypothesis lies in the understanding that surface temperature is a crucial driver of atmospheric and oceanic conditions, which can influence the occurrence and intensity of various weather events.
Scatter Plot conclusion
From the scattor place, it shows the overall trends and the response at the cycle level and the temperature rise-drop level. Although not all disaster type follows the trends of temperature changes, overall the trends of disasters follows the temperature rise level.
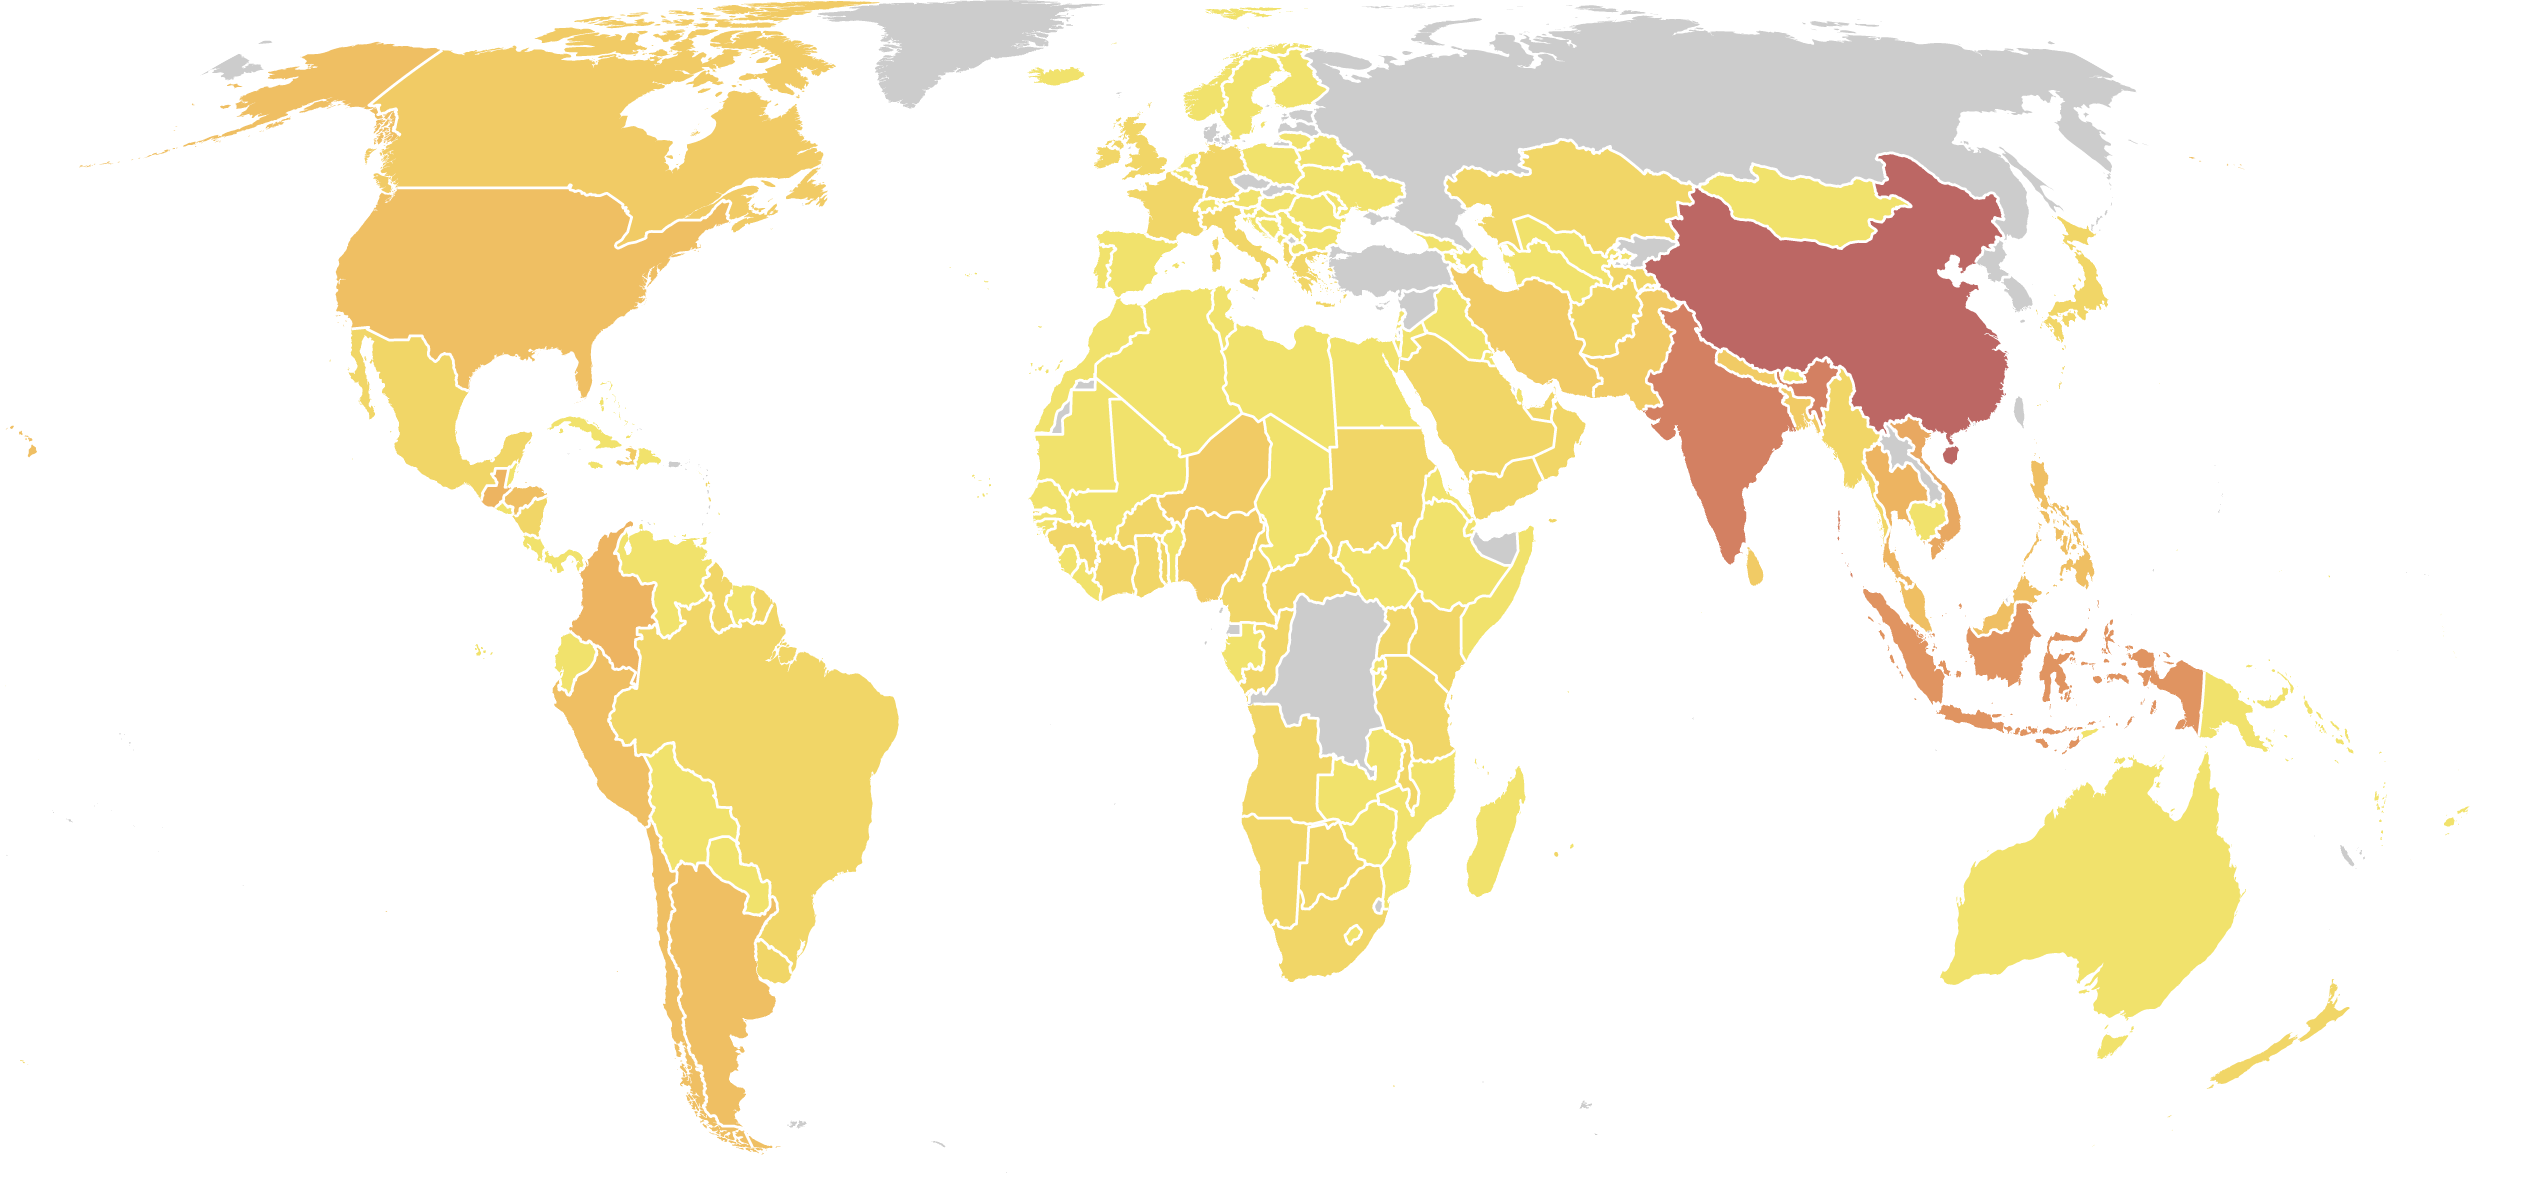
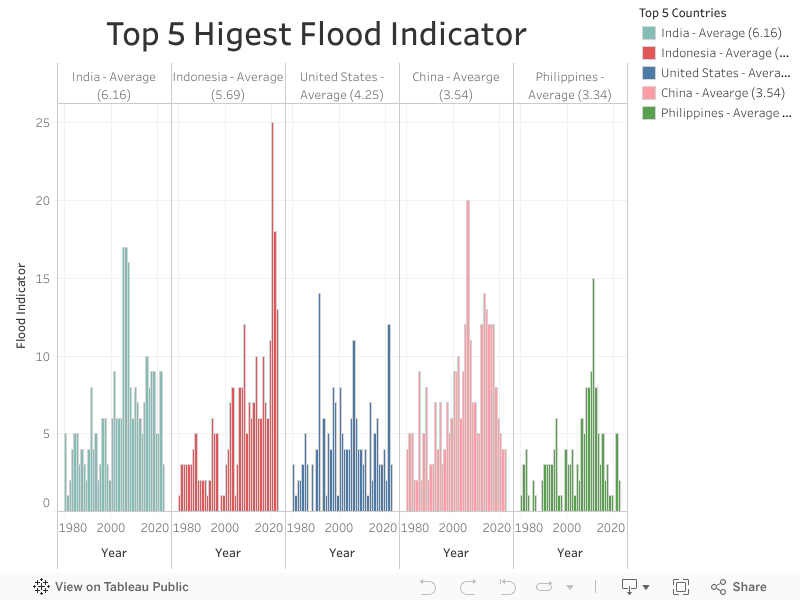
Flood Frequency By Country
Other than the total disaster indicators, flooding is the major attribute among other disasters. Human-caused warning has raised the tempurature and the global average sea level, which caused polar ice sheets melted.
The higher the baseline sea level, the easier it is for a simple high tide to send water surging into communities.Please consult the map below for information on how the flood indicator has evolved over time for different countries.
Conclusion
According to the National Oceanic and Atmospheric Administration, flooding during high tides has doubled in the United States in the past 20 years.
As the IPCC (Intergovernmental Panel on Climate Change) noted in its special report on extremes, it is increasingly clear that climate change “has detectably influenced” several of the water-related variables that contribute to floods, such as rainfall and snowmelt. In other words, while our warming world may not induce floods directly, it exacerbates many of the factors that do.